Transcription of The Normal Probability Distribution - Regent University
1 1 Property of Regent University Math Tutoring Lab, Adapted from Fundamentals of Statistics: Informed Decisions Using Data 5th Edition by Michael Sullivan III, edited 10/18/18 The Normal Probability Distribution Key Definitions Probability density Function: An equation used to compute probabilities for continuous random variables where the output value is greater than zero and the total area under the graph equals one. Normal Probability Distribution : Has the bell shape of a Normal curve for a continuous random variable. Standard Normal Distribution : The Normal Distribution with a mean of zero and standard deviation of one. Correction for Continuity: Used in the Normal approximation for a binomial random variable to account for the difference between a continuous function and discrete Probability Properties of the Normal density Curve Properties of the Normal density Curve: For a Normal density function to be a curve, it must meet the following requirements of the Probability Distribution : o The curve is symmetric around the mean.
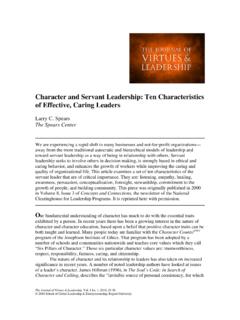
2 This means the center of the curve is the mean. o The mean, median, and mode equal the same value. This means there will only be one peak. o The area under the curve is 1. o Half of the curve (from the left-hand side to the mean and from the mean to the right-hand side) is Standardizing a Normal Random Variable Standardizing a Normal Random Variable: If a random variable is normally distributed with a mean, , and standard deviation, . Then, the random variable, , is normally distributed with mean, =0, and standard deviation, =1. Therefore, the random variable is said to have the standard Normal Distribution . The way we find the random variable, , is the following: = Understanding How to Use the Standard Normal Distribution Table How the Standard Normal Distribution Table is used with the Bell Curve: Our table uses the bell curve as a way to show us how the Distribution table operates. It is important to note the following two facts: o It starts at the left-hand side and moves to the right-hand side.
3 Therefore, Probability found under the curve starts from the left-hand side to the z-score you found on the chart. This means that the Probability we find in our chart is a less than or to the left of the z-score problem. If we want to find a more than or between Probability for our z-scores, there is extra work involved. o The mean is the highest point. Since our random variable, , has a mean, =0, this means that the highest point on the curve is when =0. 2 Property of Regent University Math Tutoring Lab, Adapted from Fundamentals of Statistics: Informed Decisions Using Data 5th Edition by Michael Sullivan III, edited 10/18/18 We used the properties of the bell-curve and these facts to help us find probabilities using the standard Normal Distribution chart. How to use the Standard Normal Distribution Table: The standard Normal Distribution table is shown in the back of your textbook. The first column (up and down) of the table represents the number to the left of the decimal of the z-score and the first number to the right of the decimal of z-score.
4 The first row (side-to-side) of the table represents the second number of the z-score to the right of the decimal. Example of using the Standard Normal Distribution Table: If we were to have a z-score that is = , the first step we do to use the table is go down the first column until you see and mark it. Next we go across the first row until we see , and we mark that column. Lastly, we go across our row and our column until they overlap. The number they meet at is the Probability of the Normal random variable. 3 Property of Regent University Math Tutoring Lab, Adapted from Fundamentals of Statistics: Informed Decisions Using Data 5th Edition by Michael Sullivan III, edited 10/18/18 Finding the Probability of a Normal Random Variable How to Find the Probability of a Normal Random Variable: When we are trying to the find the Probability of a Normal random variable, we first must standardize the random variable.
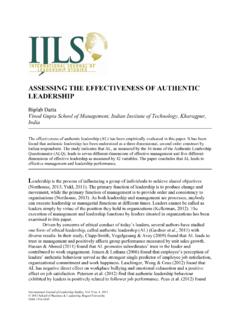
5 After we standardize the random variable, we use the standardization to find the Probability in the standard Normal Distribution table. When we are finding the Probability , it is important to note whether we are looking for the Probability to the left, right, or between variables. If we are looking to the left (or less than the random variable), we find the Probability in the table and leave it alone. If we are looking to the right (or more than the random variable), we find the Probability in the table and subtract it from 1. If we are looking for between two variables, we find both probabilities in the table and subtract the smaller from the larger. Example of Finding the Probability Less Than the Random Variable: You are given a sample data set of test scores 10 students received on their exams. The mean is = and the standard deviation is = What is the Probability that an exam score is less than 54? First, we find the standardization of the random variable which is =54: = 54 Now we can find the Probability in the standard Normal table: Based on the table, we know now that ( <54)= Example of Finding the Probability More Than the Random Variable: You are given a sample data set of test scores 10 students received on their exams.
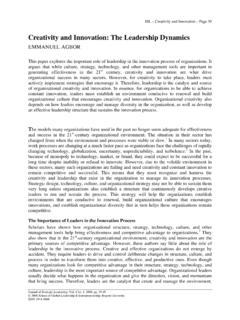
6 The mean is = and the standard deviation is = What is the Probability that an exam score is more than 54? First, we find the standardization of the random variable which is =54: = 54 Since our z-score is the same as the previous example, we know that our answer we get in the chart is But, we are finding the Probability that >54. This means, we must take our value we got from the chart and subtract it from one: ( > 54)=1 Example of Finding the Probability Between Two Random Variables: You are given a sample data set of test scores 10 students received on their exams. The mean is = and the standard deviation is = What is the Probability that an exam scores are between 51 and 54? 4 Property of Regent University Math Tutoring Lab, Adapted from Fundamentals of Statistics: Informed Decisions Using Data 5th Edition by Michael Sullivan III, edited 10/18/18 First, we find the standardizations of both random variables =51 and =54: = 51 and = 54 Now, we must find both values in the chart.
7 We know from previous examples that ( < 54)= Now, we will find the Probability for = : We find that ( < )= To find the Probability of it being between the two random variables, we must subtract the two probabilities from one another: (51< <54)= Finding the Value of a Normal Random Variable How to Find the Value of a Normal Random Variable: When we are given the Probability (area), mean, and standard deviation but not the value of , we can find from the information given to us. We do this by using the formula to find the z-score (standardizing the Normal random variable). We first find the z-score based on the Probability given to us in the problem. From there, we plug in the z-score, mean, and standard deviation into the formula. Then, we solve for . This will give us the value of the Normal random variable. Example of Finding the Value of a Normal Random Variable: You are given a sample data set of test scores 10 students received on their exams.
8 The mean is = and the standard deviation is = What is the exam score at To find this, we must first convert into a decimal and then find it in the standard Normal Distribution table. 5 Property of Regent University Math Tutoring Lab, Adapted from Fundamentals of Statistics: Informed Decisions Using Data 5th Edition by Michael Sullivan III, edited 10/18/18 To find the value in chart, we first find out in the chart Then, we go up and to the left of the Probability to find the z-score: So, we find that our z-score is = Now that we know the z-score, we are going to plug the z-score, mean, and standard deviation into the z-score equation and solve for : = ( )= ( ) ( )= ( ) + + = So, the value of the random Normal variable is = Finding the Probability of a Normal Approximation to the Binomial Probability Distribution Finding the Probability of a Binomial Probability Distribution using the Normal Approximation.
9 We can find the Probability of a binomial Probability Distribution with the standard Normal Distribution table, but we must use Normal approximation to accurately represent the binomial Distribution . To do this, we need to remember the formulas to find the mean and standard deviation of a binomial Distribution so we can plug in the proper values into our z-score formula: = = (1 ) 6 Property of Regent University Math Tutoring Lab, Adapted from Fundamentals of Statistics: Informed Decisions Using Data 5th Edition by Michael Sullivan III, edited 10/18/18 Then depending on the type of Probability you are finding, you will follow the steps described below in the following chart: Exact Probability Using Binomial Approximate Probability Using Normal Z-Score Formula Probability of Less Than, More Than, and Between ( ) ( + ) 1=( ) 2=( + ) ( + ) ( ) ( ) ( + ) =( + ) ( + ) ( ) ( ) =( ) 1 ( ) ( ) ( + ) 1=( ) 2=( + ) ( + ) ( ) From here, you will find the probabilities like a Normal z-score.
10 Example of Finding the Probability of a Binomial Probability Distribution using Normal Approximation: An experiment is conducted in which 93% of students who go to the Math Tutoring Lab regularly pass there course. What is the Probability that in a random sample of 8 people that between 6 and 8 have passed? The first thing we must do is find the mean and standard deviation of the binomial Probability : =(8)( )= = ( )= Then, we place the information that we know into the form of ( ): (6 8)= (6 8+ )= ( ) Now, we will find the z-scores and probabilities for our two values. We will find the z-score and Probability for our first value, and then find the Probability for our second value: 1=6 ( )= 2=8+ ( )= Next, we will take the two probabilities as the chart above tell us to do: ( ) ( )= Therefore, the Probability is 7 Property of Regent University Math Tutoring Lab, Adapted from Fundamentals of Statistics.