Transcription of The Oscilloscope - Rice University
1 The Oscilloscope Vision is the art of seeing things invisible. J. Swift (1667-1745) OBJECTIVE To learn to operate a cathode ray Oscilloscope . THEORY The Oscilloscope , or scope for short, is a device for drawing calibrated graphs of voltage vs time very quickly and conveniently. Such an instrument is obviously useful for the design and repair of circuits in which voltages and currents are changing with time. There are also many devices, called transducers, which convert some non-electrical quantity such as pressure, sound, light intensity, or position to a voltage. By using a transducer the scope can make a plot of the changes in almost any measurable quantity. This capability is widely used in science and technology. The heart of the Oscilloscope is a cathode ray tube or CRT, of the sort you have already studied.
2 Looking at the face of the instrument, you are viewing the screen that the electron beam strikes. Electronic circuits in the scope apply voltages to one set of deflection plates to sweep the beam across the screen from left to right at a constant rate, thereby providing the time axis. Other circuits amplify or attenuate the input signal as needed, and apply voltages to the other set of deflection plates to move the beam vertically, providing the voltage axis. Controls are provided to select the time and voltage scales needed for any given situation. At the end of each sweep, the beam is shut off and the horizontal deflection voltage is reset so the beam would start at the left edge of the screen again. Since a scope is usually used to plot a rapidly changing quantity, one sweep and therefore one plot may last only a few microseconds.
3 If the phenomenon we are studying can be made repetitive, we can repeat the sweep sequence many times to get a display suitable for a more leisurely examination. A special circuit, called a trigger circuit, examines the incoming voltage signal and starts the sweep at the same point in the repetitive cycle for each new sweep. This results in a visually steady display of the input. Several controls are provided to set the trigger as needed. The scope you will use is a very flexible instrument, typical of those available in a research laboratory. It has two channels, so that two different voltages may be plotted simultaneously for direct comparison, and a variety of triggering options. The front panel, shown in Fig.
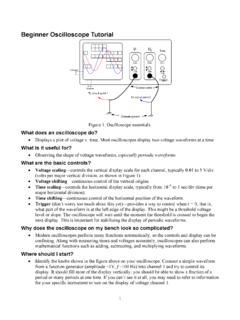
4 1, is correspondingly formidable at first glance. Fortunately, the myriad of controls can be PHYS 112 The Oscilloscope 2 considered in several independent groups, which are marked in the figure. In the remainder of this section we will examine each group in turn, concentrating on the controls we will need in subsequent experiments. The experimental procedure section will then take you through a series of measurements designed to demonstrate the operation of each section. At the left side of the instrument, the CRT screen is divided into a one centimeter grid, ruled on the inside surface of the tube. Each solid line is one division for the horizontal and vertical deflection. The dotted lines are provided for pulse rise-time measurements. Moving across the panel, we come to the power switch and the CRT controls.
5 The trace rotation and probe adjust are used only when repairing the instrument. The intensity control should be set to give a visible trace, but excessive brightness will defocus the spot and may damage the screen. Both the intensity and focus may need to be adjusted when the sweep rate is changed drastically. The beam finder is provided as an aid to setting the scope. When pushed, it reduces the deflection voltages enough that the beam will always appear on the screen. The position controls are then used to center the spot, and you should obtain a display suitable for final adjustments when the beam finder button is released. Fig. 1. Oscilloscope front panel with functional blocks marked. PHYS 112 The Oscilloscope 3 The vertical system accepts input signals and develops appropriate deflection voltages for the CRT.
6 Because this is a two-channel scope there are two identical sets of vertical controls, one for each trace. The block diagram in Fig. 2 shows the flow of signals in one channel. Voltages are applied between a grounded terminal labeled GND and either CH 1 or CH 2 for the channel desired. The coupling switch allows the input circuit to accept all signals when set at DC, or only the time-varying part when set for AC. The middle position, GND, connects the vertical amplifier input to ground, so that you can see where the zero-voltage height is on the screen. (Using the GND setting does not connect the external input terminal to ground, so your circuit will not be disturbed.) The position control allows you to place the trace on the screen as desired, for example aligning the zero-voltage position with one of the grid lines.
7 The vertical sensitivity control, labeled VOLTS/DIV is used to set the vertical scale factor. For example, when the 50m marking is next to the 1X symbol, the scope is set for a vertical scale of 50 mV per centimeter, and a deflection of 2 cm, equal to 2 large divisions, would indicate an input voltage of 100 mV. This control is normally set to make the vertical part of the signal a convenient size on the screen. The red knob in the center of the control allows you to continuously vary the vertical scale factor, rather than using the fixed settings. This feature is occasionally useful for relative measurements, but for quantitative work you need to know the calibration, and you must use the fixed steps. Turning the red knob fully clockwise sets the control for the fixed steps marked on the main control.
8 The controls labeled VERTICAL MODE select several related functions. Starting at the left, you can display the signal from channel 1, channel 2 or from both channels. The switch at the right determines how the display is done when both channels are in use. In CHOP mode the beam LEVELSLOPEMODEMODESEC/DIVCH 1 BEAM FINDERFOCUSINTENSITYCOUPLINGPOSITIONMODE VOLTS/DIVSOURCEINT/EXTPOSITIONA ttenuatorPre-AmpDelaylineAmpTriggersyste mSweepgeneratorAmpCRT controlEXT INPUT Fig. 2. Block diagram of the Oscilloscope , showing the control functions PHYS 112 The Oscilloscope 4 is switched back and forth between the channels very rapidly, drawing many short pieces of the voltage-time graph for both channels as the sweep proceeds. In ALT mode, an abbreviation for alternate sweep, the channel 1 signal is displayed for one full sweep, the channel 2 signal is displayed on the next sweep, and so forth.
9 If the sweep time is short, ALT mode appears to display two steady graphs, but if the sweep time is long you will see an irritating flicker as one line and then the other is swept. The CHOP mode is therefore better for slow sweeps because it draws both traces together, although it cannot switch quickly enough to handle very fast signals. As a general rule, use ALT mode unless the display is slow enough to be irritating, and then switch to CHOP. The third setting, ADD, algebraically adds the input of channel 1 and 2. We will not have much use for this feature. The BW LIMIT (bandwidth limit) button allows you to cut off signals with frequencies higher than 10 MHz, so that they do not appear on the display. Most of our signals are at lower frequencies, so leaving this button in will cut out some noise without losing any information.
10 The CH 2 INVERT button inverts the signal from channel two, so that increasing positive voltages are plotted downward, rather than upward. This button should be out for normal operation. The horizontal system controls the time scale of our plots. The main control, labeled SEC/DIV, works much like the vertical sensitivity controls, with a series of fixed settings and a red variable control. Note that the scale is divided into regions for seconds, milliseconds and microseconds per division. When set for 1 ms/division, as in the figure, each one centimeter division on the screen corresponds to one millisecond. The position labeled X-Y disables the timed sweep, and allows you to plot the voltage applied to channel 2 vs the voltage applied to channel 1.