Transcription of The Parable of Google Flu: Traps in Big Data Analysis
1 FINAL FINAL POLICYFORUM. BIG DATA. The Parable of Google Flu: Large errors in u prediction were largely avoidable, which offers lessons for the use Traps in Big Data Analysis of big data. David Lazer, 1, 2* Ryan Kennedy,1, 3, 4 Gary King,3 Alessandro Vespignani 3,5,6. I. n February 2013, Google Flu the algorithm in 2009, and this Trends (GFT) made headlines model has run ever since, with a but not for a reason that Google few changes announced in October executives or the creators of the u 2013 (10, 15). tracking system would have hoped. Although not widely reported Nature reported that GFT was pre- until 2013, the new GFT has been dicting more than double the pro- persistently overestimating flu portion of doctor visits for influ- prevalence for a much longer time.
2 Enza-like illness (ILI) than the Cen- GFT also missed by a very large ters for Disease Control and Preven- margin in the 2011 2012 u sea- tion (CDC), which bases its esti- son and has missed high for 100 out mates on surveillance reports from of 108 weeks starting with August laboratories across the United States 2011 (see the graph). These errors (1, 2). This happened despite the fact are not randomly distributed. For that GFT was built to predict CDC example, last week's errors predict reports. Given that GFT is often held this week's errors (temporal auto- up as an exemplary use of big data correlation), and the direction and (3, 4), what lessons can we draw magnitude of error varies with the from this error?
3 Time of year (seasonality). These The problems we identify are patterns mean that GFT overlooks not limited to GFT. Research on considerable information that whether search or social media can could be extracted by traditional predict x has become common- statistical methods. place (5 7) and is often put in sharp contrast surement and construct validity and reli- Even after GFT was updated in 2009, with traditional methods and hypotheses. ability and dependencies among data (12). the comparative value of the algorithm as a Although these studies have shown the The core challenge is that most big data that stand-alone u monitor is questionable.
4 A. value of these data, we are far from a place have received popular attention are not the study in 2010 demonstrated that GFT accu- where they can supplant more traditional output of instruments designed to produce racy was not much better than a fairly sim- methods or theories (8). We explore two valid and reliable data amenable for scien- ple projection forward using already avail- issues that contributed to GFT's mistakes ti c Analysis . able (typically on a 2-week lag) CDC data big data hubris and algorithm dynamics The initial version of GFT was a par- (4). The comparison has become even worse and offer lessons for moving forward in the ticularly problematic marriage of big and since that time, with lagged models signi - big data age.
5 Small data. Essentially, the methodology cantly outperforming GFT (see the graph). CREDIT: ADAPTED FROM AXEL KORES/DESIGN & ART was to nd the best matches among 50 mil- Even 3-week-old CDC data do a better job Big Data Hubris lion search terms to fit 1152 data points of projecting current flu prevalence than Big data hubris is the often implicit (13). The odds of nding search terms that GFT [see supplementary materials (SM)]. assumption that big data are a substitute match the propensity of the u but are struc- Considering the large number of for, rather than a supplement to, traditional turally unrelated, and so do not predict the approaches that provide inference on in u- data collection and Analysis .
6 Elsewhere, we future, were quite high. GFT developers, enza activity (16 19), does this mean that have asserted that there are enormous scien- in fact, report weeding out seasonal search the current version of GFT is not useful? ti c possibilities in big data (9 11). How- terms unrelated to the u but strongly corre- No, greater value can be obtained by com- ever, quantity of data does not mean that lated to the CDC data, such as those regard- bining GFT with other near real-time one can ignore foundational issues of mea- ing high school basketball (13). This should health data (2, 20). For example, by com- have been a warning that the big data were bining GFT and lagged CDC data, as well 1.
7 Lazer Laboratory, Northeastern University, Boston, MA over tting the small number of cases a as dynamically recalibrating GFT, we can 02115, USA. 2 Harvard Kennedy School, Harvard University, standard concern in data Analysis . This ad substantially improve on the performance Cambridge, MA 02138, USA. 3 Institute for Quantitative Social Science, Harvard University, Cambridge, MA 02138, USA. hoc method of throwing out peculiar search of GFT or the CDC alone (see the chart). 4. University of Houston, Houston, TX 77204, USA. 5 Laboratory terms failed when GFT completely missed This is no substitute for ongoing evaluation for the Modeling of Biological and Sociotechnical Systems, the nonseasonal 2009 in uenza A H1N1 and improvement, but, by incorporating this Northeastern University, Boston, MA 02115, USA.
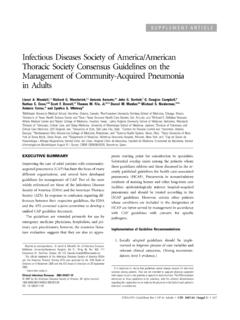
8 6 Institute for Scienti c Interchange Foundation, Turin, Italy. pandemic (2, 14). In short, the initial ver- information, GFT could have largely healed sion of GFT was part flu detector, part itself and would have likely remained out of *Corresponding author. E-mail: winter detector. GFT engineers updated the headlines. SCIENCE VOL 343 14 MARCH 2014 1203. POLICYFORUM. Algorithm Dynamics 10 Google Flu Lagged CDC. All empirical research stands on a founda- Google Flu + CDC CDC. tion of measurement. Is the instrumentation 8. Google estimates more actually capturing the theoretical construct of than double CDC estimates 6. % ILI. interest?
9 Is measurement stable and compa- rable across cases and over time? Are mea- 4. surement errors systematic? At a minimum, it is quite likely that GFT was an unstable 2. re ection of the prevalence of the u because 0. of algorithm dynamics affecting Google 's 07/01/09 07/01/10 07/01/11 07/01/12 07/01/13. search algorithm. Algorithm dynamics are 150. the changes made by engineers to improve Google Flu Lagged CDC. Google starts estimating the commercial service and by consum- high 100 out of 108 weeks Google Flu + CDC. Error (% baseline). 100. ers in using that service. Several changes in Google 's search algorithm and user behav- 50. ior likely affected GFT's tracking.
10 The most common explanation for GFT's error is a 0. media-stoked panic last u season (1, 15). Although this may have been a factor, it can- 50. not explain why GFT has been missing high by wide margins for more than 2 years. The 07/01/09 07/01/10 07/01/11 07/01/12 07/01/13. 2009 version of GFT has weathered other Data media panics related to the u, including the 2005 2006 influenza A/H5N1 ( bird flu ) GFT overestimation. GFT overestimated the prevalence of u in the 2012 2013 season and overshot the actual level in 2011 2012 by more than 50%. From 21 August 2011 to 1 September 2013, GFT reported overly outbreak and the 2009 A/H1N1 ( swine u ).