Transcription of The Power of PRE-Control - Software for Quality: Symphony ...
1 The Power of PRE-Control Planning, Design & Analysis 1 Symphony Technologies Preamble: Statistical Process control (SPC) has been one of the most favorite topics of discussions and articles for quality professionals. Very large number of articles and books have been published on SPC. There is one technique that finds very little or no attention. This is PRE-Control (PC). Perhaps this is so because it is too simple to understand and implement! PRE-Control : PRE-Control is a technique that helps shop operators to control the process so that defective parts are not produced.
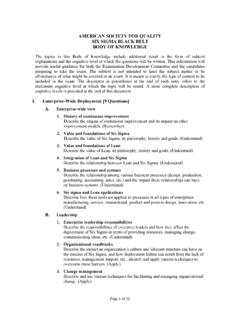
2 Although simple to understand for even the shop operators, PRE-Control is statistically robust. Unlike SPC where we need 25 subgroups before we can draw control limits and conclusions, PRE-Control starts giving feedback about the process from the very beginning making it highly responsive to the process signals, that too without charting! In PRE-Control , the drawing tolerance is divided in three zones as shown in the figure. These three zones are Green, Yellow, and Red. The middle half of the tolerance is the green PC zone. LTL means Lower tolerance limit and UTL means upper tolerance limit.
3 UPCL means upper PRE-Control Limit and LPCL means Lower PRE-Control Limit. If Cpk of the process is , it means that the tolerance equals 6x Sigma and the mean of the process coincides with the tolerance mean. Sigma is the standard deviation. In such a cases and assuming normal distribution, we can expect that 86 % of the readings will be in the green (PC) zone and 7% in each of the yellow zones. Thus we can expect one out of 14 readings in yellow zone. See the figure below: PRE-Control technique helps shop operators to control the process so that defective parts are not produced. Although simple to understand for even the shop operators, PRE-Control is statistically robust.
4 Unlike SPC where we need 25 subgroups before we can draw control limits and conclusions, PRE-Control starts giving feedback about the process from the very beginning making it highly responsive to the process signals, that too without charting! The Power of PRE-Control Planning, Design & Analysis 2 Symphony Technologies Thus chance of getting two consecutive readings in a yellow zone will be (1/14)x (1/14) or 1/196. This is the foundation of PRE-Control . Considering all 4 possible permutations of the consecutive 2 pieces, the chance is 4/196 or nearly 2%. In other words, operator will get a signal to adjust the process when actually it should not be adjusted 2% of the time.
5 PRE-Control Rules: To qualify set-up If five consecutive pieces are in Green zone, set-up is ok to run If one yellow, restart counting If two consecutive yellows, adjust the process If one reading is red, adjust the process Thus set up cannot be qualified unless five pieces in a row are in the green zone. If we cannot qualify the set up, then there is a clear signal that the process is not capable of producing parts within specification. In such a case, efforts must be made to reduce process variation so that The Power of PRE-Control Planning, Design & Analysis 3 Symphony Technologies capability index improves.
6 This is the Power of PRE-Control . It just does not allow an incapable process to run. If the operator makes an attempt to continue, he/she has to check all parts as the set up does not get qualified. Sample two consecutive pieces A and B. If both are green or one is yellow and the other is green, continue. If both A and B are yellow on the same side, adjust the process. If yellows are on the opposite sides, call for help as this may require review of the process. If any of the pieces is red, adjust the process. In such a case, parts produced from the last sampling must be inspected.
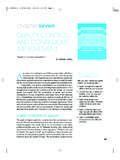
7 Sampling Intervals: Average six sample pairs between consecutive adjustments are recommended4. Following table may be useful: Average time between process adjustments Sampling Interval for pairs 8 Hours Every 80 minutes 4 Hours Every 40 minutes 2 Hours Every 20 minutes 1 Hour Every 10 minutes The Power of PRE-Control Planning, Design & Analysis 4 Symphony Technologies Impact of Cpk: The above graph shows the chance of getting five greens in a row for various CPk values assuming normal distribution and process mean equals tolerance mean. The probability drops sharply below CPk of For CPk of , this is This drops to for CPk of Thus for lower values of process capability, it becomes more and more difficult to qualify the process with the rule of five greens in a row forcing corrective action to reduce variation.
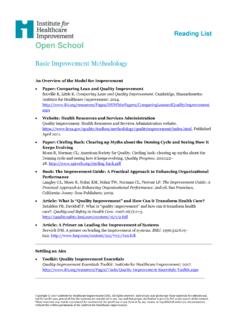
8 The number of pieces required to qualify the process is in a way an indicator of its capability. One small-scale manufacturer was doing 100 % inspection on a part machined on boring machine even though the capability index was This was because the operators were adjusting the process based on their judgment. The part tolerance is 25 microns. After changing over to PRE-Control , the adjustment was far better and closer to the mean. He could then shift to sampling while producing defect-free parts! Gauging for PRE-Control : Sometimes, color marking can be provided on the gauging to make PRE-Control more operator-friendly.
9 An example of air gauge marked for PRE-Control is shown here. The Power of PRE-Control Planning, Design & Analysis 5 Symphony Technologies PRE-Control for one-sided tolerance: The following figures illustrate how to divide one-sided tolerances: Case I: Zero is the Best: Flatness, Concentricity Case II: Maximum or Minimum: Yield Strength Concluding remarks on PRE-Control : Although PRE-Control is very simple to use, it is not a substitute for control charts. The purpose of control charts is to monitor process to detect presence of assignable causes, if any. Process log is maintained with control Charts making it a useful tool to understand variation with time and relate it to various events.
10 PRE-Control on the other hand is a simple tool that helps to prevent manufacture of defective parts. It does not require any charting by the worker. The Power of PRE-Control Planning, Design & Analysis 6 Symphony Technologies Dorian and Peter Shainin strongly recommend (1) that PRE-Control should be used by workers and special inspectors should not be provided to measure samples. They also discourage asking workers to make charts or tally sheets. The purpose of shop is to make good product and not charts or records! References: 1. quality control Handbook by J. M. Juran. 2.