Transcription of The Quantitation and Identification of Artificial ...
1 P 1 The Quantitation and Identification of Artificial Sweeteners in Food and Drink by liquid chromatography tandem mass spectrometry (LC-MS/MS) Stephen Lock 1 AB SCIEX, Warrington, Cheshire ( ) Overview Artificial sweeteners are food additives whose use has been controlled by European Parliament guidelines. The method described in this application note, shows how LC-MS/MS can be used to simultaneously detect and confirm the presence of several Artificial sweeteners. The method is both quicker than conventional non LC-MS/MS methods and more sensitive. This has meant that these compounds can be detected in samples below ingredient levels using a simple dilute and shoot approach. Introduction As we aim to eat less sugar, many of us are turning more and more to alternative sweeteners. Intense sweeteners such as Acesulfame (E950), Aspartame (E951), Cyclamate (E952), Saccharin (E954), and Sucralose (E955) are very low in calories and are safer for teeth (Figure 1).
2 As with all additives, sweeteners are thoroughly assessed for safety before they are permitted, and are only then permitted in a limited range of products. The European Parliament has set out guidelines for the labeling of food containing Artificial sweeteners (Directive 94/35/EC on sweeteners for use in foodstuff with several amendments 96/83/EC, 2003/115/EC, and 2006/52/EC) and it has deemed that the presence of Aspartame and Aspartame-Acesulfame salt should state that the food contains a source of phenylalanine . In addition some sweeteners cannot be used in foods for infants and young children, mentioned in Directive 89/398/EC. At present standard methods, for the detection of sweeteners in food, use LC with evaporating light scattering This work shows where LC-MS/MS can be used to detect seven commercially available Artificial sweeteners in diet drinks and baby food which were obtained from local supermarkets.
3 The method has several advantages over the existing methodology in that it is five times faster as well as more than 100 to 1000 fold more sensitive. In all cases, due to the sensitivity of the technique and the level of Artificial sweeteners, the samples had to be diluted at least 100 fold before analysis thus reducing the effects of matrix on the analysis and simplifying sample preparation. Experimental Sample Preparation Samples of soft drinks such as cola, orange flavored fizzy drink and lemonade were diluted 100 or 1000 fold in water. To test the method on baby food an off the shelf sample of fruit was spiked with Artificial sweeteners at 10 parts per million (ppm) and mixed with distilled water in a ratio of 1 part baby food to 9 parts water and shaken for one minute. The extract was centrifuged and then diluted 1 in 10 with water before LC-MS/MS analysis.
4 LC Samples were separated by reversed-phase LC on a polar end capped column (4 m, 150 x mm), at 800 L/min using a Shimadzu UFLC system. The gradient was over 6 minutes from 5% to 100% methanol in water. Both the water and methanol mobile phases had been modified by the addition of triethylamine and formic acid. p 2 MS/MS Analysis was performed using an AB SCIEX 3200 QTRAP LC/MS/MS system fitted with a Turbo V source in Electrospray Ionization (ESI) mode and run in negative polarity. The detected Multiple Reaction Monitoring (MRM) transitions are listed in Table 1. Figure 1. Structures for seven commercially available Artificial sweeteners in the present method Table 1. MRM transitions used in the method Compound Q1 (amu) Q1 (amu) Acesulfame 162 82 162 78 Aspartame 293 200 293 261 Cyclamate 178 80 178 79 Glycyrrhizin 821 351 821 113 Neohesperidin 611 303 611 166 Saccharin 182 42 182 106 Sucralose 395 359 397 361 Confirmation of the identity of the compound has been further enhanced by the automatic generation of an Enhanced Product Ion (EPI) scan triggered by the MRM transition of a sweetener.
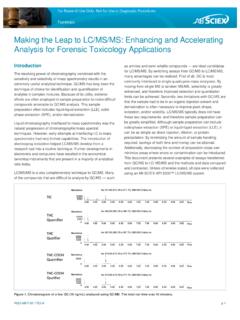
5 Results and Discussion It can be seen that all the Artificial sweeteners can be detected at concentrations of low parts per billion (ppb), Figure 2, with no carry over observed. Figure 2. An example of the chromatogram obtained from a water blank (top) and a 10 ppb standard of Artificial sweeteners in water (bottom) When this method was applied to real samples it was found that drinks taken off supermarket shelves had to be diluted 100 or even a 1000 times to be within the range of the calibration standards (Figure 3). All the Artificial sweeteners found in the samples corresponding to those which were listed on the ingredient labels. When this method was applied to a spiked baby food sample again all the sweeteners were observed at the spike level which was similar to the level used in drink manufacture. From the peak heights shown in Figure 2 it can be seen that the sensitivity for the Artificial sweeteners vary by over 2 orders of magnitude, with the acidic Cyclamate the most sensitive and Sucralose the least.
6 This wide ranging sensitivity is down to the structural differences between these compounds which not only produces a wide range of different molecular weights but also a wide range pKa. OSCH3ON-OOONHOOHNH2 OOCH3 SNHOOONHSOOO-OOOHOHOOHOOHCH3 OHOHOHOHOOOHCH3 OClOHOOOHOHClOHOHClOOOHOHOCH3CH3CH3CH3CH 3 OCH3 OOHCH3 OHOOOHOOHOHOHA cesulfameSaccharineGlycyrrhizinSucralose AspartameCyclamateNeohesperidinXIC of -MRM (14 pairs): DaID: sodium cyclamate 1 from Sample 1 (blk) of , min0200400600800100012001400 Intensity, cpsXIC of -MRM (14 pairs): DaID: sodium cyclamate 1 from Sample 20 (10ppb)..Max. , , p 3 Figure 3. Chromatograms obtained from a 1000 dilution of a lemonade sample (top) and of cola sample (bottom). The two sweeteners detected corresponded to those listed on the drink s label. Figure 4. An example of the chromatogram obtained from a baby food sample (top) and 10ppm spike of sweeteners into baby food (bottom) Little or no retention was found with standard reversed phase columns (C8 and C18) or a polar end-capped columns using a standard ammonium acetate buffered gradient making the use of an ion pairing reagent necessary.
7 The early elution and complex nature of some sweeteners also leads to some quadratic calibration curves (Figures 5). The non linearity has also been observed by other groups using ammonium acetate buffered LC conditions2 and was improved in this work by the addition of triethylamine into the mobile phase. The non linearity starts below the point of normal detector saturation and seems to be a result of ionization efficiency and possibly the pH of sample and could probably be corrected further by the use of deuterated internal standards. Figure 5. Examples of calibration curves for three commonly detected Artificial sweeteners [Aspartame (top), Cyclamate (middle) and Acesulfame (bottom)], as it can be seen some compounds produce a non linear response over the range from 1 to 1000 ppb, Even with the varying intensities and the complex nature of these compounds good robustness and reproducibility was observed.
8 The coefficients of variation (%CV) observed from the repeat analysis of solvent standards are all less than 15% (except for Sucralose which was ) at 10 ppb and less than 10% at 100 ppb even with no internal standard present for any of the compounds (Table 2). An additional advantage of using the AB SCIEX 3200 QTRAP system is the possibility to confirm the identity of compounds based on automatically acquired EPI spectra. EPI spectra contain a complete molecular fingerprint of the detected analyte resulting in increased confidence of Identification . An example of this is shown in Figure 6 where Acesulfame and Aspartame where identified using EPI spectra which were identical to those generated from standards. XIC of -MRM (14 pairs): DaID: Aspartame 2 from Sample 61 (lemonade 1 , , cpsXIC of -MRM (14 pairs): DaID: Aspartame 2 from Sample 57 (cola 1 , , cpsAcesulfameAspartameAspartameSaccharin ecolalemonadeXIC of -MRM (14 pairs): DaID: sodium cyclamate 1 from Sample 77 (BABY , min02004006008001000120014001600 Intensity, cpsXIC of -MRM (14 pairs): DaID: sodium cyclamate 1 from Sample 53 (baby , , baby foodblank baby foodAspartameCyclamateAcesulfame For Research Use Only.))))
9 Not for use in diagnostic procedures. 2011 AB SCIEX. The trademarks mentioned herein are the property of AB Sciex Pte. Ltd. or their respective owners. AB SCIEX is being used under license. Publication number: 2170611-01 Headquarters International Sales 353 Hatch Drive Foster City CA 353 Hatch Drive Foster City CA 94404 USA For our office locations please call the division Phone 650-638-5800 headquarters or refer to our website at Table 2. Reproducibility from the repeat injections (n=6) at 10 ppb and 100 ppb Compound (# of MRM transition) MRM Transition Concentration (ppb) %CV Acesulfame 1 10 2 100 1 10 2 100 Aspartame 1 10 2 100 1 10 2 100 Cyclamate 1 10 2 100 1 10 2 100 Glycyrrhizin 1 10 2 100 1 10 2 100 Neohesperidin 1 10 2 100 1 10 2 100 Saccharin 1 10 2 100 1 10 2 100 Sucralose 1 10 2 100 1 10 2 100 Figure 6.
10 Examples of Identification of sweeteners in a cola flavored drink by the automatic generation of EPI spectra Summary The work to date shows that Artificial sweeteners can be easily detected in negative polarity LC-MS/MS using Electrospray Ionization and well below current levels used in the drink industry. The method is more than five times faster than non LC-MS/MS methods currently available and due to the high sensitivity a much reduced sample pre-treatment is possible. References 1 Buchgraber and A. Wasik: Validation of an analytical method for the simultaneous determination of nine intense sweeteners by HPLC-ELSD Report EUR 22726 EN (2007) 2 Christiane Barthel, Eurofins: (2010) personal communication TIC of -MRM (18 pairs): Exp 1, from Sample 4 (cola 1 in 100 dilution) of samples MRM , ( ) Charge (+0) FT ( , ( ) Charge (+0) FT ( , ( ) Charge (+0) FT ( , ( ) Charge (+0) FT ( , , cpsIntensity, cpsIntensity, cpsIntensity, cpsIntensity, in colaAcesulfame standardAspartamein colaAspartamestandar))))