Transcription of The rise and rise of women’s employment in the UK
1 The rise and rise of women s employment in the UKIFS Briefing Note BN234 Barra RoantreeKartik ViraThe rise and rise of women s employment in the UK Barra Roantree Kartik Vira Copy-edited by Judith Payne Published by The Institute for Fiscal Studies ISBN 978-1-911102-85-4 The authors gratefully acknowledge funding from the ESRC Centre for the Microeconomic Analysis of Public Policy based at the Institute for Fiscal Studies (ES/M010147/1) and thank Chris Belfield, Monica Costa Dias, Jonathan Cribb, Paul Johnson and Robert Joyce for their helpful comments. Data from the Labour Force Survey, the Family Expenditure Survey and its successors (the Expenditure and Food Survey and the Living Costs and Food Survey) are Crown Copyright and reproduced with the permission of the Controller of HMSO and the Queen s Printer for Scotland. The authors are grateful to the Centre for Longitudinal Studies and the UCL Institute of Education for the use of the National Child Development Study (NCDS) and the British Cohort Study (BCS), and to the UK Data Service for making all the data used in this briefing note available.
2 The authors bear entire responsibility for all analysis and interpretation of these data. Executive summary Key findings the past 40 years, the UK has seen an almost continual rise in the proportion ofwomen in employment . The employment rate among women of prime working age (aged 25-54) is up from 57% in 1975 to a record high of 78% in predominantly reflects an increase in full-time employment , from 29% in 1985(when data on hours of work began) to 44% in aggregate changes are largely the result of a huge change in working patternsat particular points in the life cycle, with far more women in employment over thecourse of their mid-to-late 20s and early is in part because women are now cohabiting and having children both lessfrequently and later in life. The share of women living with a partner or spouse by age25 has fallen from more than 80% for women born in the 1940s to less than 60% forwomen born in the 1970s, while the share of women born in 1975 who had given birthto at least one child by age 25 (31%) is around half that of women born in 1945 (60%).
3 Is also because women are now much less likely to drop out of the labour marketaround the time they have their first child, and much more likely to stay in paid work inthe years following. Whereas only 41% of women born in 1958 were still in work 2years after the birth of their first child, this figure was 58% for women born in 1970 even though the employment rates of these cohorts were essentially the same both 5years before and 10 years after the birth of their first has led to a large rise in the proportion of working-age mothers in paid work: upfrom 50% in 1975 to 72% in 2015. The rise has been particularly large among lonemothers and mothers of pre-school- and primary-school-age , the proportion of couples with children where only one adult works hasalmost halved (down from 47% in 1975 to 27% in 2015) and the proportion where bothwork has increased from 49% to 68%.
4 In maternal employment have been largest among the partners of higher-earning men. 40 years ago mothers partnered with men in the bottom and top halves of the male earnings distribution were equally likely to be in paid work themselves,with employment rates of around 60%. Those figures are now around 70% and 80%respectively. In other words, for every additional mother in employment partneredwith a lower-earning man, there are around two additional mothers in employmentpartnered with a higher-earning employment rates for working-age women have risen nationally, London hasbeen overtaken In 1975, London s employment rate among women aged 25-54 wasthe highest in the UK, at 63%. By the mid 2000s it had been overtaken by every otherregion in this respect. Despite strong employment growth in recent years, in 2017 itsfigure of 74% was the joint-lowest in the UK, together with Northern Institute for Fiscal Studies Over the past 40 years, the UK has seen a sustained rise in the share of working-age women in paid employment or The UK economy looks dramatically different today from how it did in the 1970s.
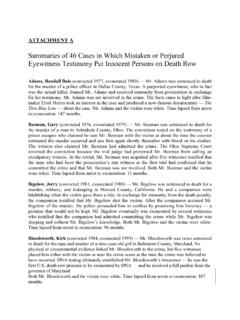
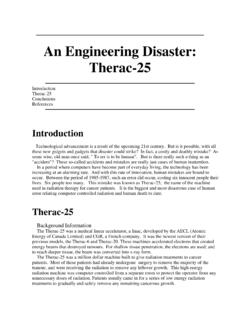
5 One of the most striking changes in the labour market is the the increased share of women in employment . Focusing here and throughout this briefing note on those aged 25 54 (often called the prime working-age group) the proportion in paid work (including self- employment ) is up from 57% in 1975 to 78% in 2017. As Figure 1 shows, this increase was most rapid over the late 1980s , with the employment rate rising by 10 percentage points between 1983 and 1990 alone. But it has continued rising almost continuously since and is already well above its pre-recession peak. Figure 1. employment rate for working-age women over time Note: Shows share of women aged 25 54 in either paid employment or self- employment over time. Source: Authors calculations using the Labour Force Survey. 50% 55% 60% 65% 70% 75% 80% 1975 1980 1985 1990 1995 2000 2005 2010 2015 2020 Year % of working-age women in paid employment or self- employment Institute for Fiscal Studies 3.
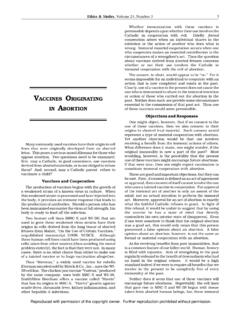
6 With the increase concentrated in full-time employment Figure 2 shows that the increase in employment has been most pronounced for full-time work (defined as more than 30 hours per week), rising from 29% in 1985 when the Labour Force Survey started collecting reliable information on hours of work to 44% in 2017. The share of women aged 25 54 engaged in part-time work has, by contrast, remained remarkably stable over time, at around a third since 1985. Figure 2. employment rate for working-age women over time, by full- and part-time Note: Full-time defined as working more than 30 hours per week. Restricted to women aged 25 54. Source: Authors calculations using the Labour Force Survey. 20% 25% 30% 35% 40% 45% 50% 1975 1980 1985 1990 1995 2000 2005 2010 2015 2020 Year % of working-age women in full-time employment % of working-age women in part-time employment 4 Institute for Fiscal Studies Rises in women s employment have been partly, but by no means fully, explained by their rising education levels This increase in employment coincided with a sharp rise in educational attainment among women.
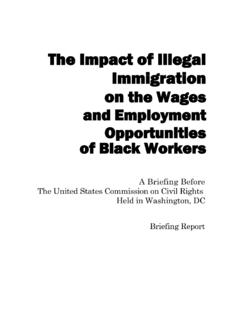
7 Figure 3 shows that whereas only 13% of women born in the early 1960s had obtained a degree or higher qualification by age 33, this figure has risen to more than 45% for women born in the 1980s . As women with degrees tend to have higher employment rates than those without (83% and 66% respectively in 1992, the first year information on qualifications was reliably collected in the LFS), this rapid increase in education levels partly accounts for the rising employment rate of women over time. However, it falls well short of fully explaining the rise in employment , since employment rates have also increased for women of a given level of education: for example, from 66% to 73% for women without degrees between 1992 and 2017. Figure 3. Share of women with degree or higher qualification at age 33, by year of birth Note: Shows share of women born in given year with degree or higher qualification at age 33.
8 Source: Authors calculations using the Labour Force Survey. 0% 10% 20% 30% 40% 50% 60% 1955 1960 1965 1970 1975 1980 1985 Year of birth % of women with degree or higher qualification at age 33 Institute for Fiscal Studies 5 Changes in the working patterns of women have been concentrated at a particular point in the life cycle: the mid-to-late 20s and early 30s A key factor underlying this rise in employment is a dramatic shift in the working patterns of women across the life cycle. Figure 4 plots the employment rate for women by decade of birth and age, showing that younger cohorts particularly those born since 1960 are working far more in their mid-to-late 20s and early 30s than previous generations. Figure 5 shows that little of this rise is due to part-time work, with women born in the 1980s around as likely to work part-time aged 30 as those born in the 1940s.
9 Instead, younger cohorts of women are much more likely to be in full-time work at any age. Figure 4. employment rate of women, by age and decade of birth Note: Shows share of women in paid employment or self- employment at each age, by decade of birth. Source: Authors calculations using the Family Expenditure Survey and its successors. Figure 5. Part-time employment rate of women, by age and decade of birth Note: Shows share of women in part-time paid employment or self- employment at each age, by decade of birth. Source: Authors calculations using the Family Expenditure Survey and its successors. 0% 25% 50% 75% 100% 25 30 35 40 45 50 55 % in employment Age 0% 25% 50% 75% 100% 25 30 35 40 45 50 55 % in part-time employment Age 1930s 1940s 1950s 1960s 1970s 1980s 1930s 1940s 1950s 1960s 1970s 1980s 6 Institute for Fiscal Studies This is partly because younger generations of women are cohabiting and starting families less frequently and later in life.
10 Figure 6 shows that the share of women living with a partner or spouse by age 25 fell from more than 80% for women born in the 1940s to less than 60% for women born in the 1970s. Much of this difference is due to younger generations doing these things later in life: the gap narrows from more than 20 percentage points to less than 5 percentage points by age 40. Similarly, Figure 7 shows that while the share of women born in 1975 who had given birth to at least one child by age 25 (31%) is around half that of women born in 1945 (60%), by age 40 the gap narrows to around 10 percentage points. Figure 6. Share of women living with a spouse or partner, by age and decade of birth Source: Authors calculations using the Family Expenditure Survey and its successors. Figure 7. Share of women who have had at least one live birth, by age and year of birth Source: Table 2 in Office for National Statistics Childbearing for women born in different years data set.