Transcription of The Roots of Gender Inequality in Developing …
1 ANNUAL. REVIEWS Further The Roots of Gender Click here for quick links to Annual Reviews content online, including: Inequality in Developing Other articles in this volume Top cited articles Top downloaded articles Countries Our comprehensive search Access provided by Northwestern University on 10/30/17. For personal use only. Seema Jayachandran Annu. Rev. Econ. :63-88. Downloaded from Department of Economics, Northwestern University, Evanston, Illinois 60208;. email: Annu. Rev. Econ. 2015. 7:63 88 Keywords First published online as a Review in Advance on Gender discrimination, economic development, cultural norms, February 20, 2015. son preference The Annual Review of Economics is online at Abstract This article's doi: Is the high degree of Gender Inequality in Developing countries in education, personal autonomy, and more explained by underdevel- Copyright 2015 by Annual Reviews.
2 Opment itself? Or do the societies that are poor today hold certain All rights reserved cultural views that lead to Gender Inequality ? This article discusses JEL codes: J16, O10, O14, O15 several mechanisms through which Gender gaps narrow as countries grow. I argue that although much of the GDP/ Gender - Inequality relationship can be explained by the process of development, society- specific factors are also at play: Many countries that are poor today have cultural norms that exacerbate favoritism toward males. Norms such as patrilocality and concern for women's purity help explain the male-skewed sex ratio in India and China and low female employ- ment in India, the Middle East, and North Africa, for example. I also discuss why the sex ratio has become more male-skewed with de- velopment.
3 Finally, I lay out some policy approaches to address Gender Inequality . 63. 1. INTRODUCTION. Gender gaps favoring males in education, health, personal autonomy, and more are sys- tematically larger in poor countries than in rich countries. This article explores the root causes of Gender Inequality in poor countries. Is the higher level of Gender Inequality explained by underdevelopment itself? Or do the countries that are poor today have certain characteristics and cultural beliefs that lead to the larger Gender gaps? I begin by documenting some basic facts about how Gender Inequality correlates with the level of economic development. I then discuss several mechanisms through which the process of eco- nomic development theoretically could improve the relative outcomes of women and review recent evidence on these mechanisms.
4 I argue that although much of the relationship between development and Gender Inequality can be explained by the process of development, society-specific factors are also at play. Many countries that are poor today have cultural features that exacerbate favoritism toward males. Being poor is insufficient to explain parents' strong desire to have a son in China and India, for Access provided by Northwestern University on 10/30/17. For personal use only. Annu. Rev. Econ. :63-88. Downloaded from example. I then discuss in greater detail the problem of the male-skewed sex ratio at birth, which differs from most other manifestations of Gender bias in that it has been intensifying, not lessening, with economic development. Finally, I lay out some policy approaches to accelerate the narrowing of Gender gaps.
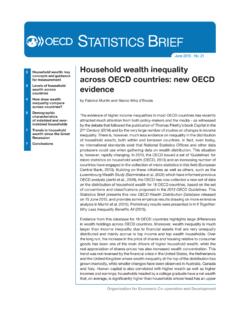
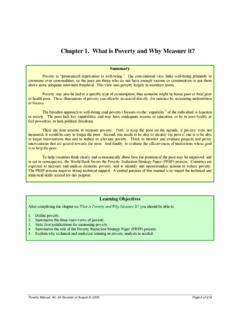
5 Note that the article's focus is the causes rather than effects of Gender Inequality , and thus I do not review the literature on the reverse direction of causality, that is, how Gender Inequality hinders economic Nonetheless, much of the discussion hints at inefficiencies that result from constricted opportunities for women and girls. 2. MORE Gender Inequality IN POOR COUNTRIES: SOME FACTS. Poor countries by no means have a monopoly on Gender Inequality . Men earn more than women in essentially all societies. However, disparities in health, education, and bargaining power within marriage tend to be larger in countries with low GDP per capita. Education and Health Figure 1a shows the ratio of the male and female college enrollment rates plotted against GDP per capita for countries included in the World Bank's World Development Indicators (WDI) data set.
6 The relationship is downward sloping: The male bias in college-going falls (and in fact evaporates). as GDP increases. Although the correlation cannot be interpreted as a causal relationship, it is strong: In a univariate regression of the college Gender ratio on log GDP per capita, the R2 is , equivalent to a correlation of A negative relationship between the schooling Gender gap and Supplemental Material GDP is also seen for primary and secondary school enrollment (see Supplemental Figure 1; follow the Supplemental Material link from the Annual Reviews home page at org; the Supplemental Appendix also describes the data in more detail). As with many of the cross-country patterns shown below, the college-GDP relationship mirrors the time-series pattern seen within many countries as their economies grow.
7 The male to female 1. Readers are referred to Duflo (2012) on the bidirectional relationship between women's empowerment and development and to Doepke et al. (2012) on the link between legal rights for women and development. 64 Jayachandran a 4. R 2 = Ratio of male to female tertiary 3. enrollment rate 2. India China 1. Access provided by Northwestern University on 10/30/17. For personal use only. Annu. Rev. Econ. :63-88. Downloaded from 0. 1,000 4,000 16,000 64,000. GDP per capita (log scale). Americas Asia and Oceania Europe Middle East and N. Africa Sub-Saharan Africa b R 2 = Ratio of male to female life expectancy 1. China India 1,000 4,000 16,000 64,000. GDP per capita (log scale). Americas Asia and Oceania Europe Middle East and N.
8 Africa Sub-Saharan Africa Figure 1. Gender gaps in (a) education and (b) life expectancy. GDP per capita is the purchasing power parity adjusted value in the year the outcome (the vertical-axis variable) is measured, expressed in 2011. US dollars; data are from the World Bank's World Development Indicators (WDI). Outcome data are from WDI. In this and subsequent figures, the circle size for each country is proportional to its population (from WDI) in the year the outcome is measured, and the line shown is the best (unweighted). linear fit. The Roots of Gender Inequality in Developing Countries 65. ratio of college enrollment in the United States has declined steadily since 1950, falling below parity by 1980 and continuing to decline since then (Goldin et al.)
9 2006).2. In Figure 1a, the data points for China and India are given special attention both because they are large together they are home to over one-third of the world's population and because they are infamous for their strong son preference. Interestingly, in terms of school enrollment, neither China nor India is an outlier. Turning to health, in general women have a longer life expectancy than men, but this female advantage is somewhat smaller in poor countries (Figure 1b). The pattern is not explained by the disease composition varying with the level of development; even for a given cause of death, women have higher age-adjusted mortality relative to men in poor countries than in rich ones (Anderson & Ray 2010). Most sub-Saharan African countries are above the best-fit line in Figure 1b; the HIV/AIDS epidemic has hit Africa hard and has decreased female life expectancy disproportionately.
10 Access provided by Northwestern University on 10/30/17. For personal use only. Annu. Rev. Econ. :63-88. Downloaded from Employment Figure 2a plots the ratio of the male and female labor force participation rates versus GDP. per capita. The correlation is essentially zero. India stands out for the underrepresentation of women in the labor force; men are three times as likely as women to be working. Female labor force participation (FLFP) is also abnormally low in the Middle East and North Africa. Even though actual FLFP is not systematically higher in rich countries, attitudes about women in the labor force are more progressive in rich countries. Figure 2b uses the World Values Survey (WVS), a set of nationally representative surveys fielded to both men and women; I use wave 5, conducted between 2004 and 2009, because wave 6 data for India was not yet available when this article was written.