Transcription of The State of the Project Management Office (PMO) …
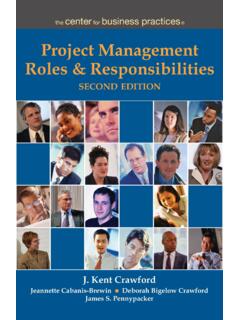
1 The State of the Project Management Office (PMO) 2016 Enabling Strategy Execution Excellence2 The State of the PMO 2016: Enabling Strategy Execution excellence 2016 Project Management Solutions, < US$100M%27%Mid-sizeRevenueUS$100M $1B%40% LargeRevenue > US$1 BRespondents by TitleRespondents by Size of FirmLeader of the PMO - 33% Project /Program Manager - 21%VP/Director Project /Program Management - 18%PMO Staff Member - 9%Chief Project Officer, CIO, or other C-Level - 8%Other - 14%Respondents by IndustryNORTH AMERICAEUROPEASIA &PACIFICMIDDLE EAST& AFRICACENTRAL & SOUTH AMERICA%4%%4%%12% 71%%9%Respondents by GeographyProfessional & Technical ServicesManufacturingHealthcareFinance & InsuranceInformationEnergyPublic AdminPharma, Retail, Education & OtherOrganizationsParticipating 226 IntroductionPM Solutions Research first surveyed organizations about their Project /Program Management Office (PMO) practices in 2007. In our latest survey, we ve taken another look at the PMO, which has become the central organizational structure for standardizing the practices of companies in the delivery of their projects.
2 This research will help us understand PMO trends pointing to solutions that will lead organizations to success in these complex, fast-changing The State of the PMO 2016: Enabling Strategy Execution excellence 3 2016 Project Management Solutions, the fifth iteration of our biennial study, we find that PMOs have consolidated their position as a strategic partner in today s organizations. The majority of organizations either have PMOs or are planning to implement one in the coming year; and for those PMOs that have been in place for over five years, expansion of responsibilities and improvements in results are remarkable. Their value is rarely questioned by the organization, and they are more likely to engage in tasks that impact strategic planning, governance, and portfolio Management . These more mature PMOs have an impact, not only on projects and programs, but on overall organizational success. As a group, their results provide an aspirational model for PMOs still finding their way.
3 PMOs have become a standard feature of the organizational landscape: 85% of respondents have a PMO, up 5% from our 2014 survey. And 30% of those without a PMO plan to implement one within the next year, the same as our 2014 survey. Professional services (70%) firms are less likely to have a PMO than other industries. There s a significant growth in the percentage of manufacturing firms that have PMOs (93% in 2016 vs. 78% in 2014). PMOs continue to age and with age comes wisdom. The average PMO is 5 years old (up from 4 years in 2014) with 56% being 5 years old and older (up from 47% in 2014). Still, 24% of PMOs are 2 years old or less (down from 30% in 2014). Most importantly, there is a direct and strong correlation between the age of the PMO and its capability. And PMOs in high-performing organizations are on average older than those in low performers (6 years vs. 3 years). Most PMOs report to a Vice President or higher; 49% to the C-level.
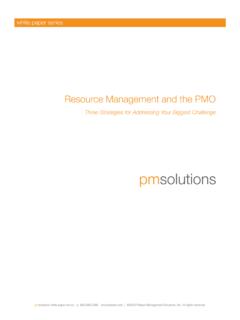
4 In general, PMOs focus on Project Management and strategy execution functions, which makes sense. Implementing governance processes and PM standards and policies, aligning projects with strategic objectives, portfolio tracking, and coaching and mentoring are the top functions performed by the A Decade, Mature PMOs Point the WayPercentage of Firms with PMOsSmall: Revenue <US$100 MMid-Size: Revenue US$100M $1 BLarge: Revenue >US$1B SMALL MID-SIZE LARGE % % % 75 83 95 Summary Findings A majority of firms (85%) have a PMO in place. PMOs are a strategic resource. Most report to a VP or higher; 49% directly to the C-level. There is a direct correlation between the age of the PMO and its capability. PMOs are now more likely to engage in tasks that impact strategic planning, governance, and portfolio Management .
5 PMOs in high-performing organizations contributed a significantly higher percentage of value in all measures of performance. More than half of PMOs use contracted resources to manage projects/programs. PMOs in high-performing firms are far more likely to have a training program in place. PMO staffs are highly experienced (10 years) and almost half (45%) have PMPs. There is a direct correlation between PMO capability and the value it contributes to the organization. The State of the PMO 2016 34 The State of the PMO 2016: Enabling Strategy Execution excellence 2016 Project Management Solutions, Capability Defined Level 5: Best in Class Continuous improvement processes-practices used enterprisewide Level 4: Strategic Standard portfolio Management processes-practices used enterprisewide Level 3: Institutionalized Standard PM processes-practices used across the enterprise Level 2: Established Standard PM processes-practices used consistently Level 1: Basic Basic PM processes-practices used inconsistently Level 0: None No formal PMO or one is under developmentValue to the OrganizationOrganizational Performance DefinedHigh-performing organizations are defined by the extent they realise their organizational goals.
6 Respondents rated their companies on a score from 1 to 5, where 1=to no extent and 5=to a very great extent on how well they met eight measures of organizational performance: strategy execution, shareholder satisfaction, financial success, schedule/budget performance, customer satisfaction, resource allocation, strategic alignment, Project prioritization. High performers rank in the top 25% in overall performance. Low performers rank in the bottom 25%.High Performers Deliver Significantly Greater Value in Improving the Alignment of Projects with Business ObjectivesOne of the unique aspects of this study is that it examines not only what PMOs do, but attempts to validate whether or not those functions impact both Project /program performance and organizational success. We do this by measuring two distinct aspects of PMO and corporate performance:PMO CapabilityPMOs in the study were asked to rank their internal capability based on six levels of PMO capability (see PMO Capability Defined left).
7 They were also asked to rate how well their organizations performed on each of eight measures of organizational performance based on a scale of one to five (see Performance Defined at left). We then averaged the ratings across all eight measures of organizational performance based on the level of PMO Capability the results are shown in the chart on page five. Organizational PerformanceRespondents to the survey also rate their sponsoring organization on an array of performance measures (see Organizational Performance Defined at left). The resulting data allows us to sort respondents organizations into two groups, High Performers (those that score in the top 25%) and Low Performers (those that score in the bottom 25%). Comparing the functions, results and challenges of these two groups provides an indication of the organizational value of PMO functions and capabilities. The average level of PMO capability remained the same from 2014 to 2016 ( ).
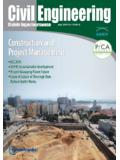
8 Unsurprisingly, PMOs in high-performing organizations rate much higher in PMO capability than those in low performers ( vs ). 4 The State of the PMO 2016 LOW PERFORMERS HIGH PERFORMERS65%improvement in aligning projects with business objectives19%improvement in aligning projects with business objectives The State of the PMO 2016: Enabling Strategy Execution excellence 5 2016 Project Management Solutions, Inc. LEVEL 0 LEVEL 1 LEVEL 2 LEVEL 3 LEVEL 4 LEVEL the PMOs capability improves, the performance of the organization increases, based on a scale of 1-5 on how well they met eight measures of organizational performance (see PMO Capability Defined and Organizational Performance Defined on page 4). PMOs in manufacturing organizations rate a lower level of capability ( ) than those in other industries. External- Project -focused PMOs rate much higher than internal-focused PMOs ( vs ), primarily because of the larger number of Level 4/Level 5 PMOs (18% vs.)
9 4%). The value and results the PMO has contributed in the past 12 months was slightly better than the value and results reported in the 2014 survey. In general, PMOs in small organizations contributed a higher percentage of value in most measures of performance (except for cost savings per Project ). In general, there is a direct correlation between the capability of the PMO and the value it has contributed to the organization over the past 12 months. Again, unsurprisingly, PMOs in high-performing organizations contributed a significantly higher percentage of value in all measures of performance, especially in percentage improvement in projects aligned with business objectives (65% vs. 19%).43%Improvement in alignment of projects with firm s objectivesPMO VALUE DELIVEREDPMO VALUE DELIVEREDPMO VALUE DELIVERED25%Decrease in failedprojects$175 kCost savings per Project (in US Dollars)33%Improvement in projects delivered under budgetPMO VALUE DELIVEREDPMO VALUE DELIVEREDPMO VALUE DELIVERED27%Improvement in customer satisfactionImprovement in productivity25%Greater PMO Capability Leads to Greater PerformancePMOs in high-performing organizations are, on average, twice as old as those in low performers (6 vs.
10 3 years)6 The State of the PMO 2016: Enabling Strategy Execution excellence 2016 Project Management Solutions, from the BestThree Ways Mature PMOs Deliver More ValuePMO Size, Scope, ComplexityIn general, the greater the PMO capability the more projects it works on per year and the higher the budget per Project . High-performing organizations work on significantly more projects per year (85) than low performers (50), and their budgets per Project are smaller ($400K vs. $500K). This speaks to the more capable PMOs understanding that chunking programs into smaller, more manageable initiatives is a key way to reduce the impact of Project failures. Indeed, high-performing companies report a much greater decrease in failed projects than low performers (28% vs. 17%). Greater agility in responding to Project challenges may also play a role in this improvement, as 100% of Best-in-Class PMOs now report using Agile methodologies. The average number of projects organizations work on per year (40/55/100) increases steadily and significantly from small to mid-size to large organizations.