Transcription of The Sulu Sea - Internal wave
1 An Atlas of Oceanic Internal Solitary waves (May 2002) The Sulu Seaby Global Ocean AssociatesPrepared for the Office of Naval Research - Code 322PO185 The Sulu SeaOverviewThe sulu sea is located in the western Pacific Ocean along the west side of the Philippines(between approximately 5o and 11o N. latitude and 117o and 123o E. longitude). It is a deep-water sea, roughly circular with several exits to the Celebes Sea (to the south), the South ChinaSea (to the west), and the Pacific Ocean (to the east). It is a maritime regime that contains someof the oceans largest solitary waves with observed amplitudes up to 90 m, wavelengths between5 to 16 km, speeds in excess of m/s and lifetimes exceeding 2 et al.
2 [1985] reported that images of Internal waves in the sulu sea were first captured Defense Meteorological Satellite Program (DMSP) visible satellite imagery in the early1970's. The images showed up to 5 packets or groups of quasi-periodic waves apparentlyradiating from a small source at the southern boundary of the sea, then spreading cylindricallyand propagating NNW toward the island of Palawan (Figure 5). This imagery lead to anexperiment in the sulu sea carried out during April and May 1980, when the NOAA researchvessel Oceanographer spent 22 days collecting a variety of in-situ measurements of the regionand its Internal wave sulu sea has an average depth of over 4400 meters.
3 It is surrounded by a shallow waterregime along the edges of the adjacent landmasses and islands. The water depth in the southernregion changes rapidly, from over 4000 m in sulu sea to approximately 100 m in the area acrossthe Sulu Archipelago, returning to over 4000 m in the Celebes Sea. These bathymetric changestake place over approximately 150-km horizontal distance. Strong current flow, at times as largeas m/s in this area, particularly between Pearl Bank and Doc Can Island (to the east) andPearl Bank and the Talantam Shoal (to the west) are the sources of the sulu sea waves have also been observed among the islands in the Sulu 1 presents a summary of Internal wave characteristics from the sulu sea .
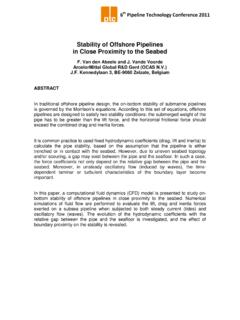
4 The values havebeen reported in the literature and derived from both in-situ and remote sensing data wave activity in the sulu sea occurs year 1. Characteristic Scales for sulu sea SolitonsPacket LengthL (km)Along Crest LengthCr (km)Maximum Wavelength MAX (km) Internal Packet DistanceD (km)25 - 3520 - 1705 - 1670-110 Amplitude2 0 (m)Long Wave Speedc0 (m/s)Wave Period(min)Surface Widthl1(m)-10 to - - 1101000An Atlas of Oceanic Internal Solitary waves (May 2002) The Sulu Seaby Global Ocean AssociatesPrepared for the Office of Naval Research - Code 322PO186 Figure 1: Bathymetry map of the sulu sea .
5 Bathymetry derived from Smith and Sandwell version Atlas of Oceanic Internal Solitary waves (May 2002) The Sulu Seaby Global Ocean AssociatesPrepared for the Office of Naval Research - Code 322PO187 Figure 2. Current meter observations in the sulu sea over 11 days, spanning neap (early times) and spring (latertimes) tides. Solitons appear at D through H. Asymmetry between adjacent packets is due to semi-diurnal anddiurnal differences, while the longer-term modulation is due to the fortnightly tides (Apel et al., 1985).
6 Figure 3a - 3d Histograms showing the distribution of Amplitude (2 o), Period (T), Full Width at Half Amplitude( ) and Wavelength ( ) for 56 well developed solitions in 17 packets observed at mooring - sulu sea Experiment 1980 The experiment conducted during April and May 1980 collected, along with other data, in-situdata from three morrings each with a phased arrary of current meters and thermistors located1) near the wave source (SS1 near 5o48' N., 119o49' E.), 2) 82 km distant from the source (SS2 -near 6o36' N.
7 , 119o36' E.) and 3) 200 km distant from the source (SS3 - near 7o45' N. 119o0' E.)Figure 2 shows the axial currents for the instruments at a depth of 100 m for moorings SS2 andSS3. The data show that semidurnal current variations dominate the record. Solitons (labeled Dthrough H) are the sharp spikes superimposed on the semidiurnal peaks. The period between 8and 12 May was relatively inactive with only a few packets containing two or three smallAn Atlas of Oceanic Internal Solitary waves (May 2002) The Sulu Seaby Global Ocean AssociatesPrepared for the Office of Naval Research - Code 322PO188amplitude solitions.
8 In contrast, 12 to 18 May showed intense Internal wave activity. Alltotaled, the moorings yeiled data on 56 well developed solitons distributed over 17 of the solitons observed at SS3 are presented in figure Meteorological Satellite Program (DMSP)In connection with the sulu sea experiment, Apel et al. [1985] performed analyses of DMSP visible satellite imagery collected during March, April and May of both 1979 and 1980. Detailedexamination of these data revealed 41 clear scenes capable in principle of showing internalwaves, 19 of which actually exhibit a number of individual crests and packets.
9 The internalwaves in DMSP images are observed in the sunglint region as stripes of rough ( dark) 1979-1980 imagery show interpacket distances ranging from 56 to 98 km, depending onazimuth and fortnightly tidal phase. Intersoliton distances ranged from 5 to 16 km. A scenefrom April 1973 is presented in figure 5. The image clearly shows five wave packetspropagating toward the island of Palawan at the top of the image. Even at 1-km resolution,individual solitons can be distinguished. The image shows the increases in crest length,wavelength, number of solitons per packet and modifications to the propagation by data from the sulu sea collected by ERS 1/2 and Radarsat during the 1990's show the sameinternal wave patterns and features of the DMSP data.
10 The strong agreement in wave signaturesbetween the radar images and the DMSP data, taken over more than two decades apart, showsthe coherency and reproducibility of the generation process. Figure 6 is a composite of 7 ERSscenes taken during three overflights in April 1996, July 1996 and January 1998. Lead solitonwavelengths vary between 2 km, shortly after formation to approximately 14 km as the wavesapproach at Palawan Island. Interpacket separations, are approximately 100 km for the threepackets visible in the April 1996 image.