Transcription of The Tools of Lean - Value Stream Mapping - ASQ …
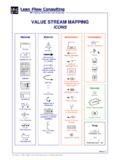
1 The Tools of lean - Value Stream MappingStan GidleyManaging DirectorInstitute of Business ExcellenceJuly 15, 2004 ASQ Section 1302 Summer 2004 SeriesMahoney State ParkOutline Two Stories 1 English, 1 Japanese Definition of VSM The limits of VSM Present State Value Stream Future State Value Stream Conclusions Reference MaterialDefinitionValue Stream Mapping :A pencil and paper tool used in two stages: a particular product's production path from beginning to end and draw a visual representation of every process in the material and information flows. draw a future state map of how Value should flow. The most important map is the future state map. The Limits of Value Stream MappingVSM becomes extremely challenging - In disjointed product development processes Where there is no product to follow Where there is high variety/low volumeBeware the people preaching the there are other, more appropriate Tools for these situationsMapping the Present State Shows work processes as they currently exist Provides understanding of the need for change Allows understanding of where opportunities lie Should be developed by a broad based team using the following structureMapping the Present Customer, Supplier and Production Control customer requirements per month and per daily production and container outbound shipping icon and truck with delivery inbound shipping icon, truck and frequencyProductionControlExample.
2 A shop with a 5-step manufacturing operation, provided by Strategos, IncMapping the Present process boxes in sequence, left to data boxes below process communication arrows and note methods and process attributes and add to data boxes. Observe all times directly! operator symbols and numbersMapping the Present inventory locations and levels in days of demand and graph at push, pull and FIFO other information that may prove working and Lead Total Cycle Time and Lead Time IMAX=MachineInspect Present State ExampleProductionControlIIIIIIW eeklyDaily2500 Hone Cln/Deb Package1111 Ship-4 3360-6 16803500200020002000 Prod Supervisor10,080 pcs/mo(-4) 6720(-6) 3360504 pcs/day(-4) 336(-6) 16812 containers/dDailyDailyDailyDailyDailyCT= 44 sC/O= 60 minLot 1000 Avail = 27600 sUptime = 87%CT= 40 sC/O= 5 minLot 1000 Avail = 27600 sUptime = 99%CT= 5 sC/O= 0 minLot 1000 Avail = 27600 sUptime =80%CT= 30 sC/O= 5 minLot 1000 Avail = 27600 sUptime = 99%CT= 10 sC/O= 5 minLot 1000 Avail = 27600 sUptime = 99%WeeklyLead Time =34 daysTot CT = 130 secTot Wk time= 130 secMonthly F castWkly OrdersMonthly F castWkly OrdersCustSupplier1 lunchAvail 460 min27,600 sec5 days44 sec10 days40 sec7 days5 sec4 days30 sec4 days10 sec4 daysMapping the Future State Requires more art, engineering and strategy than present state Need background knowledge in.
3 Cellular manufacturing Takttime Kanban Setup reduction Implementing change Kaizen Grouping technology Lot sizing Mapping the Future Average time between production units necessary to meet customer demand Divide available time by required number of units Get to the beat of the factoryTakttime= 460 min/504 pcs= min/pc= 55 sec/pcMapping the Future bottleneck processes The operation with the longest cycle time Determines total system output Becomes the primary scheduling point A work balance chart is helpfulWork Balance0102030405060 MachineHoneCln & DeburInspectPackageTaktTimeMapping the Future lot sizing / Setup opportunities Present lot size = 1000 (2 days production) Requires 3-6 days finished goods Prevents daily adjustments to mix or demand If lot size simply cut, additional set up time would preclude Machining meeting average customer requirements Focused setup reduction to 20-30 minutes would allow batch size of 500 or maybe 250 Future state map could have a Kaizen burst to achieve thisMapping the Future potential workcells The balance chart gives the indications Machine and hone are similar Very short times for cln/deburand package would normally preclude them from a cell since utilization would be low.
4 Inspect and package are manual ops requiring little more than a workbench and hand Tools . High utilization not critical. Note cln/deburis on special equipment in central area. If scaled down to a manual op, it could go in the cell Appears that 3 operators could run the cellMapping the Future Kanbanlocations With a cell of five processes scheduling between them becomes trivial. They will become directly linked with continuous or small batch flow Kanbandoes apply: Between cell and supplier Between cell and customer Illustrate detailed design of Kanbanas a Kaizen burst on Future mapMapping the Future scheduling methods Kanbanand direct link now schedule all ops Both Workcelland Supplier need forecast data to plan staffing and inventory performance dataThe Completed Future StateMapping the Future State In our example, the Mapping team estimates a Lead Time reduction of 85% and a productivity increase of 25%.
5 Inventory will decrease about 85%.Many additional, but unpredictable benefits are also sec130 secWorking Time-6644 sec130 secCycle Time-855 days34 daysLead Time% ChangeFuturePresentConclusionsValue Stream Mapping helps to: Visualize the product flow Show links between information and material and process Identify sources of waste Establish a clear future vision for the Value Stream Prioritize improvement activities Focus attention on key activities that will improve the Lead Time and reduce the Total Cost of Product