Transcription of The Truth About Fibonacci Secrets - Swing-Trade …
1 The Truth About Fibonacci Trading 2 The Truth About Fibonacci Trading The Truth About Fibonacci levels is that they are useful (like all trading indicators). They do not work as a standalone system of trading and they are certainly not the holy grail , but can be a very effective component of your trading strategy. But who is Fibonacci and how can he help you with your trading? Leonardo Fibonacci was a great Italian mathematician who lived in the thirteenth century who first observed certain ratios of a number series that are regarded as describing the natural proportions of things in the universe, including price data.
2 The ratios arise from the following number series: 1, 2, 3, 5, 8, 13, 21, 34, 55, 89, 144 .. This series of numbers is derived by starting with 1 followed by 2 and then adding 1 + 2 to get 3, the third number. Then, adding 2 + 3 to get 5, the fourth number, and so on. The ratios are derived by dividing any number in the series by the next higher number, after 3 the ratio is always After 89, it is always If you divide any Fibonacci number by the preceding number, after 2 the number is always and after 144 the number is always These ratios are referred to as the golden mean.
3 Additional ratios were then derived to create ratio sets as follows: 2004 Profits Run, Inc. Rev 01-20041124 The Truth About Fibonacci Trading 3 Price Retracement Levels , , , , Price Extension Levels 0, , , , , The first set of ratios is used as price retracement levels and is used in trading as possible support and resistance levels. The reason we have this expectation is that traders all over the world are watching these levels and placing buy and sell orders at these levels which becomes a self-fulfilling expectation.
4 The second set is used as price extension levels and is used in trading as possible profit taking levels. Again, traders all over the world are watching these levels and placing buy and sell orders to take profits at these levels which becomes a self-fulfilling expectation. Most good trading software packages include both Fibonacci Retracement Levels and Price Extension Levels. In order to apply Fibonacci levels to price charts, it is necessary to identify Swing Highs and Swing Lows. A Swing High is a short term high bar with at least two lower highs on both the left and right of the high bar.
5 A Swing 2004 Profits Run, Inc. Rev 01-20041124 The Truth About Fibonacci Trading 4 2004 Profits Run, Inc. Rev 01-20041124 Low is a short term low bar with at least two higher lows on both the left and right of the low bar. Fibonacci Retracement Levels In an uptrend, the general idea is to go long the market on a retracement to a Fibonacci support level. The price retracement levels can be applied to the price bar chart of any market by clicking on a significant Swing Low and dragging the cursor to the most recent potential Swing High and clicking there.
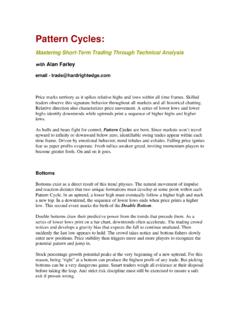
6 This will display each of the Retracement Levels showing both the ratio and corresponding price level. Let s take a look at some examples of markets in an uptrend. The same points made by these examples are equally applicable to markets in a downtrend. Example 1: Here we plotted the Fibonacci Retracement Levels by clicking on the Swing Low at About $ and dragging the cursor to the Swing High at About $ You can see the resultant levels plotted by the software. Now the expectation is that if the market retraces from this high it will find support at one of the Fibonacci Levels, because traders will be placing buy orders at these levels as the market pulls back.
7 The Truth About Fibonacci Trading 5 Example 1 Example 2004 Profits Run, Inc. Rev 01-20041124 The Truth About Fibonacci Trading 6 2004 Profits Run, Inc. Rev 01-20041124 Example : Now let s look at what actually happened after the Swing High occurred. The market pulled back right through the level and continued the next day through the level before finding support. After a few days, the market resumed its upward move. Clearly buying at the level would have been a good short term trade.
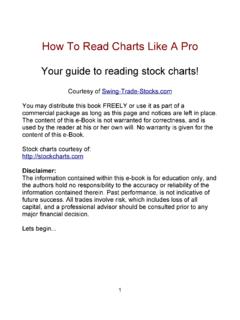
8 Example 2: Again, the Fibonacci Retracement Levels were plotted on the chart in the same manner as described in Example 1. Again, we are looking for the market to retrace from the Swing High and find support at one of the Fibonacci levels. Example : Now let s look at what actually happened. The market again pulled back right through the level and continued to pull back until it found temporary support at the level (a lot of buyers at this level). However, once the buying power was exhausted, the market continued to retrace all the way down to the level before resuming its upward trend.
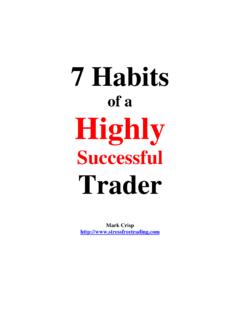
9 In this case, buying at the level would have been a good short term trade. The Truth About Fibonacci Trading 7 Example 2 Example 2004 Profits Run, Inc. Rev 01-20041124 The Truth About Fibonacci Trading 8 Example 3: Here s another example. If the market retraces from the Swing High, where will it find support? Example 3 2004 Profits Run, Inc. Rev 01-20041124 The Truth About Fibonacci Trading 9 Example : Well, in this case the market found support at the level. Buying at this level would have been a great trade as the market gapped up a few days later.
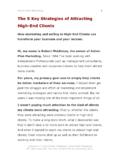
10 Example 2004 Profits Run, Inc. Rev 01-20041124 The Truth About Fibonacci Trading 10 Example 4: Here s one more example. Example 4 2004 Profits Run, Inc. Rev 01-20041124 The Truth About Fibonacci Trading 11 Example : Whoops! The market gapped down through all levels of support and never looked back. A long trade here would have been a loser or at least an open lose position. Example You can see from these examples that the market often finds at least temporary support at the Fibonacci Retracement Levels not always, but often.