Transcription of The U.S. is a Keystone of Global Science & Engineering ...
1 As the national Science Board (NSB, Board) described in Vision 2030, the data in Science and Engineering Indicators show that the is at an inflection point as Science & Engineering (S&E) is increasingly Global , demand for STEM talent rises, and knowledge- and technology-intensive industries grow. NSB s roadmap lays out the urgent action needed to ensure that the remains a Global leader in S&E. Science and Engineering Indicators 2022 shows that no nation is the world leader in all aspects of S&E. Instead of one country leading in most research areas or by most Science and Engineering metrics, nations now lead in some research fields, but not all, and by some metrics, but not by others. Going forward, countries will shift more rapidly and frequently in their positions in the discovery and innovation enterprise as many more nations participate, compete, collaborate, and contribute to the sum total of human knowledge. In this world, the no longer leads by default our country must act intentionally to achieve its strategic objectives.
2 Since across-the-board leadership in S&E is no longer a possibility, what then should our goals be? The must be a Keystone an essential nexus that is instrumental to the structure and success of the Global S&E ecosystem. The 2022 edition of Science and Engineering Indicators shows that the already is a Keystone . A Keystone bridges nations and geographic regions, connects demographic groups and disciplines, and links sectors together. These connections germinate the next breakthrough discoveries, growing them from imagination to impact. This is how our country leads today and how the can continue to lead for the decades to come if we take action is a Keystone of Global Science & EngineeringDomestic STEM TalentInternational STEM TalentCritical and Emerging TechnologiesBasic ResearchCollaborationTalent is the treasure on which the nation s prosperity, health, and security depend. The diversity of our people, and the connections fostered between them, is a wellspring of American creativity in S&E both for problem-solving, and for asking the next big questions.
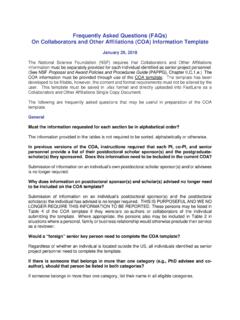
3 To be a STEM powerhouse, the must nurture talent in every state and across the many dimensions of diversity, particularly the Missing Millions. For too long, too many Americans have encountered too many obstacles to pursuing education and careers in S&E. The must do better to provide opportunities for all. NSB s Vision 2030 calls on policymakers to make K-12 STEM education a federal, state, and local priority, to ensure affordable and accessible post-secondary education, and to make S&E careers attractive and Millions: Faster progress in Increasing Diversity Needed to Reduce Significant Talent Gap Figure 1: While the number of people from under-represented groups in the S&E workforce has grown over the past decade, much faster increases will be needed for the S&E workforce to be representative of the population in 2030. To achieve that goal, the NSB estimates that the number of women must nearly double, Hispanic or Latinos must triple, Black or African Americans must more than double, and the number of American Indian or Alaska Native S&E workers needs to quadruple (from 15,000 to 60,000).
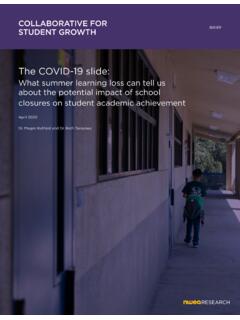
4 The NSB estimates that the number of Native Hawaiian or Other Pacific Islanders will be slightly overrepresented in the S&E workforce in 2030. These estimates are based on projections from the Census and Bureau of Labor Statistics, together with data from the 2021 Women, Minorities, and Persons with Disabilities in Science and Engineering report published by the national Center for Science and Engineering Statistics and assume that participation of these groups in the S&E workforce increases at current or LatinoBlack or African AmericanAmerican Indian or Alaska NativeLegendx 100,000 people in 2020 S&E workforcex 100,000 additional people needed in 2030 for the S&E workforce to be representative of the populationAverage Scores for 8th grade Students on the NAEP Mathematics assessment , by Ethnicity and Eligibility for Free or Reduced LunchFigure 2: 2019 national assessment of educational progress (NAEP) mathematics assessment . NAEP achievement levels are defined as Basic: 262-298; Proficient: 299-332; Advanced: 333-500.
5 NAEP is a congressionally mandated program administered by the national Center for Education Statistics and overseen by the national assessment Governing the gap for the Missing Millions includes addressing the earliest step on the STEM pathway: K-12 STEM education. At a time when the economy and the nation s Global competitiveness increasingly depend on math and Science knowledge and skills, American children have continued to fall behind, with major disparities in math performance based on race, ethnicity, and socioeconomic status (SES). Disparities in family wealth are reflected in the test performance of children. Students who are eligible for free- or reduced- lunch have lower average scores than their higher-SES counterparts and strikingly, amongst students from low-SES families, no racial or ethnic group achieves proficiency. Furthermore, the average scores of children from the Missing Millions racial and ethnic groups are consistently lower than their white and Asian peers at the same SES disparities are also apparent in test performance, with students in the Northeast scoring higher than students in the South and West, and students in suburban schools scoring higher than students in rural, town, and city schools.
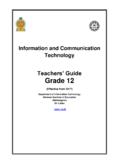
6 Addressing the persistent educational inequities that exist across dimensions of geography, race, and economic background is both an ethical and economic imperative for our EligibleEligibleProficientBasic323299298 280280277273294275270264256254254 Black or African AmericanHispanic or LatinoTwo or More RacesWhiteAsianNative Hawaiian or Pacific Islander Black or African AmericanTwo or More RacesWhiteAsianNative Hawaiian or Pacific IslanderHispanic or Latino American Indian or Alaska NativeAmerican Indian or Alaska Native2 STEM Talent Domestic and InternationalS&E Degrees Awarded by Sex and Field14,066 ,451 ,989 ,103 3: S&E associate s and bachelor s degrees awarded in the by sex and discipline, 2011-2019. In 2019, 104,435 associate s and 724,947 bachelor s S&E degrees were awarded, of which 3% of associate s and 7% of bachelor s went to temporary visa holders. The number of women earning S&E associate s and bachelor s degrees has increased significantly since 2011.
7 At both levels, a majority of the S&E degrees earned by women are in the Social and Behavioral Sciences, whereas this field accounts for only a quarter of the S&E degrees earned by s Degrees107,626 ,971 ,990 ,333 s DegreesPhysical and Earth SciencesPhysical and Earth SciencesPhysical and Earth SciencesPhysical and Earth SciencesEngineeringEngineeringEngineerin gEngineeringComputer Sciences and MathematicsComputer Sciences and MathematicsComputer Sciences and MathematicsComputer Sciences and MathematicsLife and Agricultural SciencesLife and Agricultural SciencesLife and Agricultural SciencesLife and Agricultural SciencesSocial and Behavioral SciencesSocial and Behavioral SciencesSocial and Behavioral SciencesSocial and Behavioral Sciences20112012201320142015201620172018 2019 Where are the millions missing? At all levels of STEM higher education, long-standing disparities persist. Women, both domestic and foreign-born, receive fewer post-secondary degrees in Engineering , math, and computer Science fields that underlie many critical and emerging areas in Science and technology.
8 Hispanic or Latino, Black or African American, American Indian or Alaskan Native, and Native Hawaiian or Pacific Islander students are also underrepresented across S&E fields, including at the doctoral level. These disparities arise from long-standing issues including, but not limited to, bias, lack of mentoring and role models, STEM teaching practices, underpreparation in K-12 leading to difficulty in transitioning to post-secondary education, and college cost, coupled with insufficient information about the labor market demand for STEM skills in a wide range of jobs, deter undergraduates from starting and/or completing STEM degrees. Fifty-five percent of bachelor s degree recipients graduate with student debt, which can impact the educational choices of all students from lower-SES backgrounds. These students, including a disproportionate number of individuals from Missing Millions racial and ethnic groups, have little to no intergenerational wealth to draw on for their educational part of a comprehensive strategy to diversify and strengthen the domestic S&E workforce, S&E leaders and policymakers should work to make all levels of higher education an attractive, inclusive, and financially sustainable choice for individuals from all backgrounds.
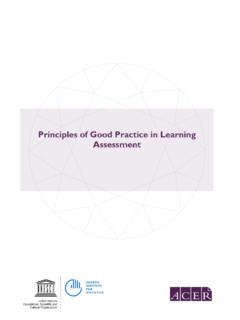
9 Physical and Earth SciencesLife and Agricultural SciencesComputer Sciences and MathematicsEngineeringThe Missing PhDs: Gaps by Race/Ethnicity and FieldFigure 4: Within each field, the boxes for race or ethnicity are sized to their relative proportion in the overall population. The solid color area within each box represents the number of doctorates awarded (2018) in the given demographic for that research field; unfilled area represents the number of additional doctorates from that demographic needed for the field to be representative of the group s proportion in the population. The box sets are scaled to illustrate the relative number of doctorates awarded to citizens and permanent residents across these degree Hawaiian or Pacific IslanderSocial and Behavioral SciencesBlack or African AmericanHispanic or LatinoAmerican Indian or Alaska Talent Domestic and InternationalNSF-EPSCoRNot NSF- EPSCoRFigure 5: Geography of federal R&D funding to institutions of higher education; states eligible for NSF s Established Program to Stimulate Competitive Research (EPSCoR) program in 2019; concentration of STEM workers, as a percentage of total employment per state, with and without bachelor s degrees in 2019.
10 Geography of concentration of patents per capita in 2019 (inset). Geography of S&EThe 100 institutions receiving the most federal R&D moneyStates in top quartile of concentration of STEM workers, as a percentage of total employment per state without a bachelor s degree (STW)States in the top quartile of concentration of STEM workers, as a percentage of total employment per state with a bachelor s degree or higherStates not in the top quartile of either category of STEM workersThe geography of S&E in the is diverse, with strengths and opportunities that vary across states. Some states are home to a high proportion of skilled technical workers (STW), while others have a high proportion of workers with S&E degrees at the bachelor s level or above. Many states host institutions of higher education that receive a substantial amount of federal R&D funding, and some states have high rates of patenting. Many states have combinations of these features, adding to the variety and richness of the nation s S&E landscape.