Transcription of The Wilcoxon Rank-Sum Test - Department of Statistics
1 1 The Wilcoxon Rank-Sum TestThe Wilcoxon Rank-Sum test is a nonparametric alternative to the two-samplet-test which is based solely on the order in which the observationsfrom the two samples fall. We will use the following as a running 1In a genetic inheritance study discussed by Margolin [1988],samples of individuals from several ethnic groups were taken. Blood sampleswere collected from each individual and several variables measured. For adetailed discussion of the study and a de nition of the variable, see Exer-cises in the text. We shall compare the groups labeled \Native Amer-ican" and \Caucasian" with respect to the variableMSCE(mean sister chro-matid exchange).
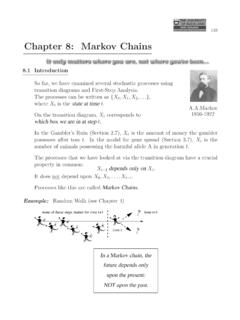
2 The data is as follows:Native American: AmericanCaucasianFigure 1 at the dot plots for the two groups, several questions come to , do the data come from Normal distributions? Unfortunately we can'tsay much about the distributions as the samples are too small. Howeverthere does not seem to be any clear lack of symmetry. Secondly, are the twodistributions similar in shape? Again it is hard to say much with such smallsamples, though the Caucasian data seems to have longer tails. Finally, isthere any di erence in the centers of location?
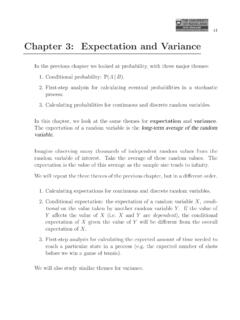
3 The plots suggest a di erencewith Native American values being larger on average. We shall now put thistype of problem in a more general context and come back to this , more generally, that we have samples of observations from eachof two populationsAandBcontainingnAandnBobserva tions wish to test the hypothesis that the distribution ofX-measurements inpopulationAis the same as that inB, which we will write symbolically asH0:A=B. The departures fromH0that the Wilcoxon test tries to detect arelocation shifts. If we expect to detect that the distribution ofAis shifted tothe right of distributionBas in Fig.
4 2(b), we will write this asH1:A> other two possibilities areH1:A<B(Ais shifted to the left ofB), andthe two sided-alternative, which we will write asH1:A6=B, for situationsin which we have no strong prior reason for expecting a shift in a (a) H : A = B(b) H : A > Bshiftdistribution A = distribution Bdistribution Adistribution B01 Figure 2 :Illustration ofH0:A=BversusH1:A> Wilcoxon test is based upon ranking thenA+nBobservations of thecombined sample. Each observation has arank: the smallest has rank 1, the2nd smallest rank 2, and so on. The Wilcoxon Rank-Sum test statistic is thesum of the ranks for observations from one of the samples.
5 Let us use sampleAhere and usewAto denote the observed rank sum andWAto represent thecorresponding random of the ranks for observations 1 have sorted the combined data set into ascending or-der and used vertical displacement as well as ethnic group labels to make veryclear which sample an observation comes from (\NA" for the Native Americangroup and \Ca" for the Caucasian group). The rank of an observation in thecombined sample appears immediately below the Ca NA Ca Ca NA Ca Ca Ca Ca NA NA NA NA Ca NARank:12345678910111213141516 The sum of the ranks for the Native American group iswNA=3+6+11+12+13+14+16=75:How do we obtain theP-valuecorresponding to the Rank-Sum test statisticwA?
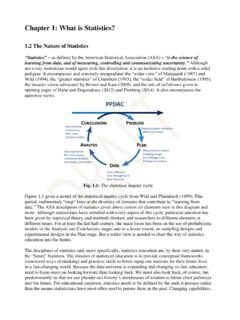
6 To answer this question we must rst consider how rank sums behaveunderH0, and how they behave underH1. Fig. 3 depicts two situations usingsamples of sizenA=nB= 5 and plotting sampleAobservations with a \ "and sampleBobservations with an \o".Suppose thatH0:A=Bis true. In this case, alln=nA+nBobservationsare being drawn from the same distribution and we might expect behaviorsomewhat like Fig. 3(a) in which the pattern of black and white circles israndom. The set of ranks fornobservations are the numbers 1;2;:::; ournobservations from a distribution are labeledAandnBobservations from the same distribution are labeledB, then as far as thebehavior of the ranks (and thuswA) is concerned, it is just as if we randomlylabelednAof the numbers 1;2;:::;nwithA's and the rest withB's.
7 Thedistribution of a rank sum,WA, under such conditions has been worked outand computer programs and sets of Tables are available for this distribution. oo o o ooooo o Rank1234567891012345678910(a)(b)Figure 3 :Behaviour of thatH1:A>Bis true: In this case we would expect behavior morelike that in Fig. 3(b) which results in sampleAcontaining more of the largerranks. Evidence againstH0which con rmsH1:A>Bis thus provided by anobserved rank sumwAwhich is unusually large according to the distributionof rank sums whenH0is true. Thus theP-valuefor the test is(H1:A>B)P-value= pr(WA wA);where the probability is calculated using the distribution thatWAwould haveifH0was true.
8 Suppose, on the other hand, that the alternativeH1:A<Bis true. In this case we would expect theAobservations to tend to be smallerthan theBobservations, resulting in a small rank sumwA. TheP-valueforthe alternativeH1:A<Bis therefore(H1:A<B)P-value= pr(WA wA):Note that in testing one-sided alternatives, the direction of the inequalityused in the calculation of theP-valueis the same as the direction de ning thealternative, >BandWA the two-sided test, testingH0:A=Bversus the alternativeH1:A6=B, a rank sum that is either too big or too small provides evidenceagainstH0. We then calculate the probability of falling into the tail of thedistribution closest towAand double it.
9 Thus ifwAis in the lower tailthenP-value= 2 pr(WA wA), whereas ifwAis in the upper tail thenP-value= 2 pr(WA wA).Example 1 , we want to test a null hypothesisH0which saysthat theMSCE distribution for Native Americans is the same as that forCaucasians. Although the Native AmericanMSCE values in the data tend tobe higher, there was no prior theory to lead us to expect this so we should be4doing a two-sided test. The rank sum for for the Native American group waswNA= 75. We know from the plot of the data that this will be in the uppertail of the distribution. TheP-valueis thusP-value= 2 pr(WNA 75)=0:114 (computer):The evidence againstH0which suggests that medianMSCE measurements arehigher for Native Americans than for Caucasians is, at best, weak.
10 In factwe can't be sure that this evidence points to a di erence in the shapes of thetwo distributions rather than a di erence in the centers of location. [We notethat, for this data set, a two-samplet-test (Welch) for no di erence in meansgives almost exactly the sameP-value.]Treatment of tiesConsider the data to follow. It has two observations tied with value 4, threemore tied with value 6 and a set of four observations tied with value :0 1225 6 6 6 7 8 101111111114 ..From:A BA BA A B B B A BAABBA ..1ton:1 2345 6 7 8 9 10 111213141516 ..Ranks:1 2 5 7 7 7 9 10 11 16.