Transcription of Thermal expansion of polytetrafluoroethylene (Teflon) from ...
1 Journal of Research of the National Bureau of Standards Vol. 57, , August 1956 Research Paper 2696 Thermal expansion of polytetrafluoroethylene (Teflon) From -1900 to +3000 C Richard K. Kirby The' linear t he rma l expa ns io n of fOlll samples of Teflo n was determined. The' re sults for T eflo n m'e indicated in a plot o f t he expa ns ion vel s us tem perature and in iI. table listing t he average coefficLCnts of lincar exp a ns io n from -J 90 to + 300 C. The effect of internal r es idual streRses on t he expansion of T efto n w as studied a nd found to be consid erable'. The fiT~t-orcier transit ions at 20 and 30 C are clearl y shown in a plot of t he coeffic ients of rxpansLOn ver s us temperature. 1. Introduction Polytetra{1uoroeth ylene (T eflon) , [- CF2-CF2-)n, is a thermoplastic r es in that is made by polymerizing tetrafluoroe thylene, Cli'2=CF2, at high temperatures and pressures (1)1 The carbon and fluorine atoms in t h e long molecules of Teflon are the form of a helix, a full 360 twist evel'Y 26 carbon atoms along its len g th (2).]}
2 Above 330 C, T e flon is transparent and is in a state similar to that or a liquid, in that it is free of strain and has no crystalline e [1, 3). A t about 325 C, T eflon starts to ze on cooling and b ecomes opaqu e and wax~r in appearance (3). X-ra~-diITraction patterns indicate that the orienta-tion is parallel with the axes of the molec ules (two-dimen sional) and that the c rystallization continues until the temperatu rc is slight,ly above room tempera-ture [2]. At abou t 30 C a flrs t-order tnmsition OCClJl"S [4, 5), which is probably due to small and uneqllal longitudinal displacements of th e molecules (2)..At about 20 C a much larger flrst-orcler transition occurs [4, 5, 6), which is probabl~' due to a rotatioll of the molecules around th eir axes (2). The expansion due to the transitions at 20 and 30 C is r eversible on heating and cooling if the tempera ture is slowly changed.]]]
3 A slight hysteresis will occur during rapid heating, and a large h ysteresis will occur during rapid cooling [4]. At temperatures below 15 C , X-ray diffraction patterns indicate a three-dimensional orientation [2]. B ecause the long polymer molecules are not straight over their entire l ength, the structure of T eflon is n ever completely crystalline. Instead, only small r egions of the structure are crystalline where straight sections of a group of molecules come to-gether in parallel alinement. These small crystalline regions arc scattered throughout the m a t erial and are tied together in a random b y the long mole-cules that pass through two or more or thrm [1). T eflon has a very ou tstanding chemical stability [1,3). At room temperature it is not affected by any of tl~e usual inorganic acids or b~r o rganic solvents and IS attacked only b~' the alkali metals and fluorine or fluorine-forming compounds at high temperatures and pressures.]]
4 T eflon is also an ou tstancling clec-1 Figures in brackets indicate the literature references at the end of tbis paper. 91 trieal insulator for high-voltage or u 1 tra-hiah-fre-quenc~~ applications (7). Because of its vel':'y low coefficient of friction verv fe w substan ces will s tick to it, and it can be used as an oil-free bearing. T eflon has one of the highest Thermal s tabilities of any known polymer, maintaining of its u scflll prope r ties up to 300 C. It at a very slo w rate below 400 (8), but, because of the toxicity of the gases evolved, sustained temperatures of over 200 C shotilcl not be llsed without proper ventilation. Although several investigations of th e Thermal expansion of Teflon have brrn ma,de, onl)~ two of them have b ee n published [4, 9). These publications were mainly concerned witll t he abnormal b ehav io r of ~eflon aro'und 2 00 and 30 C and only reported s mgle valu es for the codficien ts or expansion imme-cliatel~T below and above these temperatu res.]
5 The purpose or t hi s investigation is to r eport reliable valu es of the linear Thermal expansion of T eflon over as wiele a range of temperature as prac t ical for this material. The r esults H e given in two figu res and a table. 2 . Samples and Experimental Procedure Four samples of T eflon were illves Ligatecl, as indi-cated in table 1. The coefficients of linear Thermal expansion that arc reporLed for t hese samples w er e clete~'mined aft er i he samples had b een annealed by heatll1g to about 350 C a nd cooling slowl.\!. The valu es for the density of Lhe samples lis Led in table 1. were also determined aIler annealing. The varia-tlOns between the d ensities arc probably due Lo differences in forming techniques (pressure, temp er-ature, and length of time of the molding or extruding process) [9]. TABLE 1. Descri ption of T eflon samples investi(jetted Sample' A B C ]) Method of fonning Length m11l, Extruded.
6 76 .~ .. do .. _ .. ~ ~ ll8 .. do .. _ .. ~ .. 300 Molded_.~._.~ .. _ .. ~ 119 I Diameter mm ])e~5~it~ at (a nnealed) olem' Samples A, D, C, and]) have laboratory numbers 1867, 1871, 1868, aud 1853, respectIvely. A time-temperature curve was obtained on sample A on both heating and cooling and a single transition was located at about 3230 C. This temperature is in accord with previous investigations [1,3]. The fused-quartz tube and dial-indicator method [10] was used for the linear expansion t es ts on sam-ples A, B , and D. The dial indicator was graduated to inch. The weight of the fused-quartz rod and the spring in the dial indicator produced a force of about 150 gram s on each sample in the direction of its axis. The linear expansion of sample C was d etermined with the precision micrometric method [10]. In this apparatus the sample is in a horizontal position with no external forces applied in t he direction of its axis.
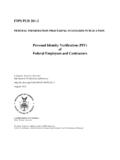
7 >-z UJ " 0: UJ a. 6 4 z 2 o Vi z a. i':i l/ ~ The cubical expansion of a sample (100 n1111 long) cut from the same rod as sample C was determined 2 with a hydrostatic weighing method [11]. The temperatures of the samples were m easured with a thermocouple placed in a hole near t h e center of each sample, except in the cubical expansion test where a thermometer was used to m easure t h e tem-perature of the water n ear the sample. T emperatures below room temperature w er e obtained by u smg ice, dry ice, and liquid air as the refrigerants. :Most of the observations of expansion were taken when the temperature of the sample was constant. 2 This determination was made by Lt. J. E. Overberger, USA, Walter R eed Army Medical Center, guest worker in Organic and Fibrous Mater ial s D ivision of th e National Bureau of Standard s. L ~ v )// -----V ~ 1// ~ 600 500 400 300 z o Vi z a. x 200 w "-o 100 <f> >-Z UJ ~ "-OJ o " a ~",?
8 1>" Y o~ '-~~\CI'-"'S -----cO'-~ . a ~ j +-~'" ~ / -I / ~ -2 -200 -100 a 100 200 300 TEMPERATURE :C FIGURE 1. L inear Thermal expansi on and of linear Thermal expansion of annealed T eflon (sample A ). 92 3 . Results and Discussion In the comse of this investigation not only were most of the observations of expansion made on sample A but they were also made over a much wider temperatme range than on the other samples. Figme 1 shows the cmve for the linear cxpansion of sample A from about - 190 to +300 C in the annealed condition and the cmve for its correspond-ing coefficients of expansion . The points to which the expansion cmve was fitted, as indicated in the figme, are averages of the actual observations and are plotted as the expansion from an arbitrary zero at 25 C. This temperatme was chosen because it is located about midway between the transitions at 20 and 30 C. The curve representing the coefficients of expansion versus temperature was obtained by calculating the average coeffieients between the actual consecutive observations of expansion and correcting them so that they represent the true thermodynamic coeffi-cients of linear Thermal expansion a= (l/L) (dL/dt), where L is the length at to C.
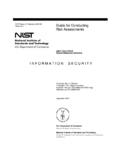
9 This cmve shows quite clearly the first-order transitions at 20 and 30 C and also indicates the great increase in the rate of expansion at temperatmes approaching the transi-tion at 323 C. The results of the expansion measurements on all four samples from 0 to llO C in the annealed condition are shown in figme 2. The cmve repre-sents the expansion of sample A and is the same as '--'---'--"--'---'---'--'---'---'--'--' I-~ u "-z o ~ <1 "-> < w o o / l 20 40 60 80 100 TEM PERATURE, C FI(lURE 2. Comparison oj the linear thennal expansions of four samples oj annealed T eflon. Every expansion test is plotted as zero at 25 C. The curve represents the expansion of sample A; 0, first test of sample B; e , second test of sample B ; o . linear expansion test of sample C; . cu bieal expansion test of sam pIe C plotted as linear_expansion; /',., test of sample D. 93 in figure 1. Figure 2 indicates that the expansions of all fom samples are comparable.)
10 In fact, their expansions can be shown to be equal within the experimental error found in the measurements of expansion of sample A alone. It was found dming the comse of this investigation that the length and Thermal expansion of Teflon are greatly affected by residual stresses within the samples. This was d emonstrated by comparing the expansion and/or length of each sample in the annealed condition with their corresponding proper-ties in a strained condition. After sample D had been annealed it was machined from a diameter to a rod. This treatment apparently had the effect of stretching the sample because after a second anneal-ing it was found to be shorter by percent. The effect of this induced strain was to decrease the rate of expansion by about 14 percent. Samples A and C were found to be and percent longer, respectively, in the annealed condi-tion than they were in their extruded conditions.