Transcription of Thin layer chromatography TLC - BMB & Chemistry IT
1 thin layer chromatography . thin layer chromatography , or TLC, is a method for analyzing mixtures by separating the compounds in the mixture. TLC can be used to help determine the number of components in a mixture, the identity of compounds, and the purity of a compound. By observing the appearance of a product or the disappearance of a reactant, it can also be used to monitor the progress of a reaction. TLC is a sensitive technique - microgram ( g) quantities can be analyzed by TLC. - and it takes little time for an analysis (about 5-10 minutes). TLC consists of three steps - spotting, development, and visualization. Photographs of each step are shown on the course website. First the sample to be analyzed is dissolved in a volatile (easily evaporated) solvent to produce a very dilute (about 1%) solution. Spotting consists of using a micro pipet to transfer a small amount of this dilute solution to one end of a TLC plate, in this case a thin layer of powdered silica gel that has been coated onto a plastic sheet.
2 The spotting solvent quickly evaporates and leaves behind a small spot of the material. Development consists of placing the bottom of the TLC plate into a shallow pool of a development solvent, which then travels up the plate by capillary action. As the solvent travels up the plate, it moves over the original spot. A competition is set up between the silica gel plate and the development solvent for the spotted material. The very polar silica gel tries to hold the spot in its original place and the solvent tries to move the spot along with it as it travels up the plate. The outcome depends upon a balance among three polarities - that of the plate, the development solvent and the spot material. If the development solvent is polar enough, the spot will move some distance from its original location. Different components in the original spot, having different polarities, will move different distances from the original spot location and show up as separate spots.
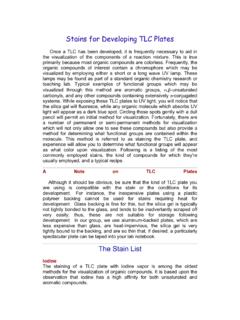
3 When the solvent has traveled almost to the top of the plate, the plate is removed, the solvent front marked with a pencil, and the solvent allowed to evaporate. Visualization of colored compounds is simple the spots can be directly observed after development. Because most compounds are colorless however, a visualization method is needed. The silica gel on the TLC plate is impregnated with a fluorescent material that glows under ultraviolet (UV) light. A spot will interfere with the fluorescence and appear as a dark spot on a glowing background. While under the UV light, the spots can be outlined with a pencil to mark their locations. A second method of visualization is accomplished by placing the plate into iodine vapors for a few minutes. Most organic compounds will form a dark-colored complex with iodine. It is good practice to use at least two visualization techniques in case a compound does not show up with one particular method.
4 The Rf value is used to quantify the movement of the materials along the plate. Rf is equal to the distance traveled by the substance divided by the distance traveled by the solvent. Its value is always between zero and one. A TLC analysis might be summarized something like, "Using a silica gel plate and ethyl acetate as the development solvent, unknown mixture X showed three spots having Rf's of , , and ". Comparing these Rf's with the Rf's of known compounds might enable a tentative identification to be made. Note that observing three spots means only that there are at least three components in the mixture. Some components may have such similar polarities that they appear under one spot after development. 1. Rf = Y/X (always 1). If a development solvent of too high a polarity is used, all components in the mixture will move along with the solvent and no separation will be observed (Rf's will be too large).
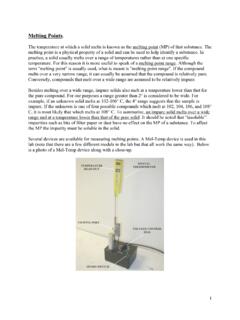
5 If the solvent is of too low a polarity the components will not move enough, and again separation will not occur (Rf's will be too small). In practice, different solvents or mixtures of solvents are tried until a good separation is observed. Typically an effective solvent is one that gives Rf's in the range of - Note that the spotting solvent is simply used as a vehicle to transfer the material to be analyzed to the TLC plate. Once the transfer is made the spotting solvent evaporates. It has no effect on the separation. It is the development solvent that effects the separation. What's going on at the molecular level during development? There are three components in TLC: (1) the TLC plate (stationary phase), the development solvent (mobile phase), and the sample to be analyzed (solute). In our experiment the TLC plate consists of a thin plastic sheet covered with a thin layer of silica gel, a portion of the structure of which is shown below.
6 OH OH OH. Si O Si O Si O. O O O. Si Si Si O. O O. Silica gel consists of a three-dimensional network of thousands of alternating silicon and oxygen bonds, with O-H groups on the outside surface. Silica gel is simply very finely ground very pure sand. It should be noted that silica gel is highly polar and is capable of hydrogen bonding. Consider the side-on view of the development of a TLC plate below. As the solvent travels up the plate, over the spot, an equilibrium is set up, as development solvent competes with the TLC plate for the solute. The silica gel binds to the solute and the development solvent tries to dissolve it away, carrying the solute(s) along as the solvent travels up the plate. 2. A balance of intermolecular forces determines the position of equilibrium and thus the ability of the solvent to move the solute up the plate. In other words, would the spot prefer to be stuck on the plate or would it prefer to move along with solvent.
7 The balance depends upon (1) the polarity of the TLC plate (constant and high), (2) the polarity of the development solvent (can be varied by using different solvents), and (3) the polarity of the compounds in the spot (this varies depending upon what compounds are in the spot). For example, if a sample consists of two components, one more polar than the other, the more polar will tend to stick more tightly to the plate and the less polar will tend to move along more freely with the solvent. Using a more polar development solvent would cause both to move along further. If the approximate structures of the solutes are known, it is possible to make an educated guess as to what solvent or mixture of solvents to use. In practice though, for a given mixture of compounds to be analyzed, a solvent or mixture of solvents is chosen by trial and error to give the best separation. (A. caveat: the polarity argument is helpful in understanding the principles of TLC.)
8 Because most compounds have some polarity the argument works well. For compounds having very low polarity however, a lower-polarity solvent may be more effective in moving the solute up the plate.). To illustrate a TLC experiment, consider the following example of the analysis of a two-component mixture. 3. The polarity of molecules, solutes and solvents alike, is ordered as follows, from least to most polar: Alkanes (least polar), alkyl halides, alkenes, aromatic hydrocarbons, ethers, esters, ketones, aldehydes, amines, alcohols, and carboxylic acids (most polar). Note however that many molecules contain multiple functional groups and that the overall polarity would be determined by all of the groups. Experimental Procedure. (rev 1/08). This experiment consists of two parts: (1) analyzing two different analgesics to determine the number of compounds in each and the identity of those compounds and (2) studying the effect of solvent polarity on Rf.
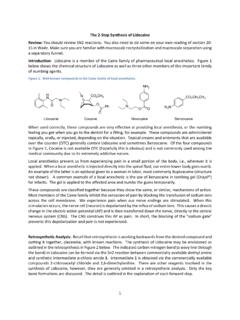
9 Look over the photos showing TLC on the course website. (1.) TLC analysis of analgesics. Spotting. The powdered side of the silica gel plate, not the shiny, plastic side is the side that is spotted. Lightly draw a pencil line about 1 cm from the end of a plate. Use a pencil, not a pen, and be careful to not scratch the surface of the plate too deeply. The plates are of such a size that only three spots can be run on each. Use a fresh pipet for each spot. Make each spot as small as possible (less than about 1 mm diameter). After applying the spots check them under the UV lamp to see that they are of a reasonable size. The UV light must be held close to the plate to see the spots (CAUTION: do not look directly into the UV light.) If the spot is much too large, prepare a new plate. If a spot is too small, add more solution. Analyze two unknown analgesics in the following way: two of the three known compounds (references) plus the first analgesic to be analyzed (unknown 1) will be spotted on one plate, the same two knowns plus the second analgesic (unknown 2) will be spotted on a second plate, and both analgesic 1 and analgesic 2 along with the third known compound will be spotted on a third plate (see Figure below).
10 (If the plates were 4. wider, you could analyze each unknown on just one plate.) To obtain a sample of a known solution, bring a micropipet to the sample solution at the side bench, dip it into the solution to fill it, then take it back to your workspace for spotting (Use only micropipets for obtaining samples; do not use Pasteur pipets to take larger amounts of samples that could lead to contamination). Try to minimize traffic at the side bench and take care to not contaminate the solutions with a micropipet that has already been used. The purpose of the experiment is to determine which of the known compounds are contained in the analgesics that you chose to analyze. Solutions of the known compounds will already be made. You must make 1% solutions of the unknown analgesics. To do this, take a small part of a crushed tablet and add enough ethanol to make an approximately 1%. solution (very approximate - do not weigh samples).