Transcription of TI 83/84 Calculator The Basics of Statistical Functions
1 1 TI 83/84 Calculator The Basics of Statistical Functions What you want to do >>> Put Data in Lists Get Descriptive Statistics Create a histogram, boxplot, scatterplot, etc. Find normal or binomial probabilities Confidence Intervals or Hypothesis Tests How to start STAT > EDIT > 1: EDIT ENTER [after putting data in a list] STAT > CALC > 1: 1-Var Stats ENTER [after putting data in a list] 2nd STAT PLOT 1:Plot 1 ENTER 2nd VARS STAT > TESTS What to do next Clear numbers already in a list: Arrow up to L1, then hit CLEAR, ENTER. Then just type the numbers into the appropriate list (L1, L2, etc.) The screen shows: 1-Var Stats You type: 2nd L1 or 2nd L2, etc. ENTER The Calculator will tell you , s, 5-number summary (min, Q1, med, Q3, max), etc. 1. Select On, ENTER 2. Select the type of chart you want, ENTER 3. Make sure the correct lists are selected 4. ZOOM 9 The Calculator will display your chart For normal probability, scroll to either 2: normalcdf(, then enter low value, high value, mean, standard deviation; or 3:invNorm(, then enter area to left, mean, standard deviation.))
2 For binomial probability, scroll to either 0:binompdf(, or A:binomcdf( , then enter n,p,x. Hypothesis Test: Scroll to one of the following: 1:Z-Test 2:T-Test 3:2-SampZTest 4:2-SampTTest 5:1-PropZTest 6:2-PropZTest C:X2-Test D:2-SampFTest E:LinRegTTest F:ANOVA( Confidence Interval: Scroll to one of the following: 7:ZInterval 8:TInterval 9:2-SampZInt 0:2-SampTInt A:1-PropZInt B:2-PropZIn Other points: (1) To clear the screen, hit 2nd, MODE, CLEAR (2) To enter a negative number, use the negative sign at the bottom right, not the negative sign above the plus sign. (3) To convert a decimal to a fraction: (a) type the decimal; (b) MATH > Frac ENTER 2 Frank s Ten Commandments of Statistics 1. The probability of choosing one thing with a particular characteristic equals the percentage of things with that characteristic. 2. Samples have STATISTICS. Populations have PARAMETERS. 3. Unusual means more than 2 standard deviations away from the mean; usual means within 2 standard deviations of the mean.)))
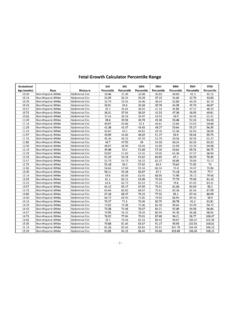
3 4. Or means Addition Rule; and means Multiplication Rule 5. If Frank says Binomial, I say npx. 6. If (sigma/the standard deviation of the population) is known, use Z; if is unknown, use T. 7. In a Hypothesis Test, the claim is ALWAYS about the population. 8. In the Traditional Method, you are comparing POINTS (the Test Statistic and the Critical Value); in the P-Value Method, you are comparing AREAS (the P-Value and (alpha)). 9. If the P-Value is less than (alpha), reject H0 ( If P is low, H0 must go ). 10. The Critical Value (point) sets the boundary for (area). The Test Statistic (point) sets the boundary for the P-Value (area). 3 Chapters 3-4-5 Summary Notes Chapter 3 Statistics for Describing, Exploring and Comparing Data Calculating Standard Deviation s = Example: x x (x - )2 1 -5 25 3 -3 9 14 8 64 Total 98 = 6 (18/3) s = = = 7 Finding the Mean and Standard Deviation from a Frequency Distribution Speed Midpoint (x) Frequency (f) x2 f x f x2 42-45 25 46-49 14 665 50-53 7 54-57 3 58-61 1 50 2339 = , so s = , so s = = Percentiles and Values The percentile of value x = (round to nearest whole number) To find the value of percentile k: L = ; this gives the location of the value we want; if it s not a whole number, we go up to the next number.
4 If it is a whole number, then the answer is the mean of that number and the number above it. **Using the Calculator : To find mean & standard deviation of a frequency distribution or a probability distribution: First: STAT > EDIT ENTER, then in L1 put in all the x values (midpoints if it s a frequency distribution); in L2 put in frequencies or probabilities as applicable. Second: STAT > CALC ENTER 1-Var Stats 2ND L1, 2ND L2 ENTER. The screen shows the mean ( ) and the standard deviation, either Sx (if it s a frequency distribution) or x (if it s a probability distribution). Chapter 4 - Probability Addition Rule ( OR ) P(A or B) = P(A) + P(B) P(A and B) Find the probability of at least 1 girl out of 3 kids, with boys and girls equally likely. 0 girls) = P(all boys) = .125* P(at least 1 girl) = P(1, 2 or 3 girls) = 1 minus .125 = .875 These are complements, so their combined probability must = 1. Fundamental Counting Rule: For a sequence of two events in which the first event can occur m ways and the second event can occur n ways, the events together can occur a total of m n ways.
5 Factorial Rule: A collection of n different items can be arranged in order n! different ways. ( Calculator Example: To get 4!, hit 4 MATH>PRB>4 ENTER Multiplication Rule ( AND ) P(A and B) = P(A) P(B|A) Conditional Probability P(B|A) = Permutations Rule (Items all Different) 1. n different items available. 2. Select r items without replacement 3. Rearrangements of the same items are considered to be different sequences (ABC is counted separately from CBA) Calculator example: n = 10, r = 8, so 10P8 Hit 10 MATH > PRB > 2, then 8 ENTER = 1814400 Permutations Rule (Some Items Identical) 1. n different items available, and some are identical 2. Select all n items without replacement 3. Rearrangements of distinct items are considered to be different sequences. # of permutations = Combinations Rule 1. n different items available. 2. Select r items without replacement 3. Rearrangements of the same items are considered to be the same sequence (ABC is counted the same as CBA) Calculator example: n = 10, r = 8, so 10C8 Hit 10 MATH > PRB > 3, then 8 ENTER = 45 * All boys means #1 is a boy AND #2 is a boy AND #3 is a boy, so we use the Multiplication Rule.)
6 5 x .5 x .5 = .125 4 Formulas for Mean and Standard Deviation All Sample Values Frequency Distribution Probability Distribution Mean Std Dev Chapter 5 - Discrete Probability Distributions Sec. A random variable is simply a number that can change, based on chance. It can either be discrete (countable, like how many eggs a hen might lay), or continuous (like how much a person weighs, which is not something you can count). Example: The number of Mexican-Americans in a jury of 12 members is a random variable; it can be anywhere between 0 and 12. And it is a discrete random variable, because it is a number you can count. To find the mean and standard deviation of a probability distribution by hand, you need 5 columns of numbers: (1) x; (2) P(x); (3) x P(x); (4) x2; (5) x2 P(x). Using the Calculator : To find the mean and standard deviation of a probability distribution, First: STAT > EDIT, then in L1 put in all the x values, and in L2 put in the probability for each x value.
7 Second: STAT > CALC > 1-Var Stats > 1-Var Stats L1, L2 ENTER. Sec. Binomial Probability Requirements ___ Fixed number of trials ___ Independent trials ___ Two possible outcomes ___ Constant probabilities Formulas = n p q = 1 - p Using the Calculator 1. To get the probability of a specific number: 2nd VARS binompdf (n, p, x) (which gives you the probability of getting exactly x successes in n trials, when p is the probability of success in 1 trial). 2. To get a cumulative probability: 2nd VARS binomcdf (n, p, x) (which gives you the probability of getting up to x successes in n trials, when p is the probability of success in 1 trial). IMPORTANT: there are variations on this one, which we will talk about. Be sure to get them clear in your mind. At most/less than or equal to: binomcdf(n,p,x) Less than: < binomcdf(n,p,x-1) At least/greater than or equal to: 1 minus binomcdf(n,p,x-1) Greater than/more than: > 1 minus binomcdf(n,p,x) Symbol Summary Sample Population How many?
8 N N Mean Proportion p Standard Deviation s Correlation Coefficient r 5 Chapters 6-7-8 Summary Notes Ch Topic Calculator Formulas, Tables, Etc. 6 Normal Probability Distributions 3 Kinds of problems: 1. You are given a point (value) and asked to find the corresponding area (probability) 1a. Central Limit Theorem. Just like #1, except n > 1. 2. You are given an area (probability) and asked to find the corresponding point (value). 3. Normal as approximation to binomial 1. 2nd VARS normalcdf (low, high, , ) 1a. 2nd VARS normalcdf (low, high, , ) 2. 2nd VARS invNorm (area to left, , ) 3. Step 1: Using binomial formulas, find mean and standard deviation. Table A-2. 3. (cont d Normal as approximation to binomial) Step 2: If you are asked to find Then in Calculator P(at least x) normalcdf( ,1E99, , ) P(more than x) normalcdf(x+.5,1E99, , ) P(x or fewer) normalcdf(-1E99,x+.)
9 5, , ) P(less than x) normalcdf(-1E99, , , ) 7 Confidence Intervals 1. Proportion 2. Mean (z or t?) 3. Standard Deviation < < 1. STAT > TEST > 1 PropZInt Minimum Sample Size: PRGM NPROP 2. STAT > TEST > ZInt OR STAT > TEST > TInt (use Z if is known, T if is unknown) Minimum Sample Size: PRGM NMEAN 3. PRGM >INVCHISQ (to find and ) PRGM > CISDEV (to find Conf. Interval.) 1. = sample proportion; E = z /2 Min. Sample Size ( unknown): Min. Sample Size ( known): 2. = sample mean; E = z /2 ( known) or E = t /2 ( unknown) Min. Sample Size: n = [ ] 3. Use Table A-4 to find and 8 Hypothesis Tests 1. Proportion 2. Mean (z or t?) 3. Standard Deviation 1. STAT > TEST > 1 PropZTest 2. STAT > TEST > ZTest OR TTest 3. PRGM > TESTSDEV 1.
10 Test Statistic: z = 2. Test Statistic: z = OR t = 3. Test Statistic: X2 = If P-Value < , reject H0; if P-Value > fail to reject H0. See additional sheet on 1-sentence statement and finding Critical Value. 6 Hypothesis Tests 1-Sentence Statement/Final Conclusion Hypoth Test Checklist ___ CLAIM ___ HYPOTHESES ___ SAMPLE DATA ___ ___ Calculator : P-VALUE, TEST STATISTIC ___ CONCLUSIONS Claim is H0 Claim is H1 Reject H0 (Type 1 reject true Ho) There is sufficient evidence to warrant rejection of the claim that .. The sample data support the claim that .. Fail to reject H0 (Type II fail to reject false Ho) There is not sufficient evidence to warrant rejection of the claim that .. There is not sufficient sample evidence to support the claim that .. To find Critical Value (required only for Traditional Method, not for P-Value Method) Critical Z-Value Left-Tail Test (1 negative CV) 2nd VARS invNorm( ) ENTER Right-Tail Test (1 positive CV) 2nd VARS invNorm(1- ) ENTER Two-Tail Test (1 neg & 1 pos CV) 2nd VARS invNorm( /2) ENTER Critical T-Value (when you get to Chapter 9, for TWO samples, for DF use the smaller sample) Left-Tail Test (1 negative CV) PRGM > INVT ENTER AREA FROM LEFT = DF = n-1 ; then hit ENTER Right-Tail Test (1 positive CV) PRGM > INVT ENTER AREA FROM LEFT = 1- DF = n-1; then hit ENTER Two-Tail Test (1 neg & 1 pos CV) PRGM > INVT ENTER AREA FROM LEFT = /2 DF = n-1.