Transcription of TION BROILER INDUSTRY PRODUCTION REPORT: JUNE 2018
1 TION BROILER INDUSTRY PRODUCTION report : DECEMBER 2018 The model has taken into account the loss of breeders due to highly pathogenic avian influenza (HPAI). The revised 2013 standards were applied in the BROILER PRODUCTION forecasting models from January 2013 onwards and were fully implemented by November 2013. Two methods are used to produce the data summarised in this report : 1. Based on the number of female parent chicks placed, the forecasting model predicts: The number of 20-week-old parent hens that will be transferred; The number of hatching eggs that will be produced; The number of BROILER chicks that will hatch; The number of broilers that will be slaughtered. This information is deemed to reflect the INDUSTRY potential. 2. Based on the number of day-old BROILER chicks hatched as supplied by commercial hatcheries, the model predicts: The number of broilers that will be slaughtered. This information is deemed to reflect the actual PRODUCTION and is regarded as a true reflection of the INDUSTRY performance.
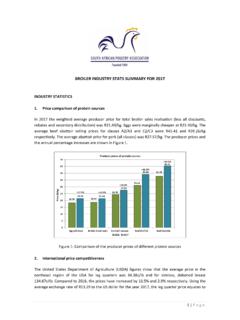
2 Comparisons are made between potential and actual figures as a means of validating both the model assumptions and the data supplied by the INDUSTRY . The reliability of the model output is dependent on the supply of accurate monthly data from BROILER hatcheries and BROILER breeder operations. We are most grateful to our regular contributors. TABLE 1: BROILER BREEDER PRODUCTION STANDARDS: 2011 2013 2011 2013 BROILER Breeder Flock: Mortality to 20 weeks of age: Laying Cycle: 20 weeks to 60 weeks 60 weeks 61 weeks 61 weeks Mortality during the laying cycle: BROILER Breeder Performance Total eggs per hen housed Hatching eggs per hen housed: BROILER chicks per hen housed: 2 1. BROILER BREEDERS Day-old parent pullets placed An average of 205 400 day-old parent pullets was placed per week in December 2018 (Graph 1). This was an increase of 37 000 parent pullets (+ ) compared to the previous month and an increase of 24 700 parent pullets (+ ) compared to the same month of the previous year.
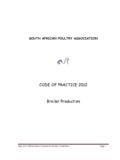
3 In total 872 900 day-old parent pullets were placed in December 2018; this was a month-on-month increase of 115 100 parent pullets (+ ), and a year-on-year increase of 105 000 parent pullets (+ ). GRAPH 1: Day-old BROILER female parents placed BROILER breeder flock The average number of breeder hens for the month under review was million (Graph 2). This was a decrease of 170 300 hens ( ) compared to November 2018, and an increase of 442 900 hens (+ ) compared to December 2017. The average age of the breeder flock was weeks. per weekThousandsDay-old BROILER parents placed(Average per week to December 2018)Disclaimer: Information in this report reflects assumptions and also actual data. The projections presented in the report are based upon specific PRODUCTION standards and indicate historic and forecasted trends only. Any and all information, data, know-how, documentation, materials and other communications, written or oral, which are disclosed or provided to SAPA or its designees by a SAPA member shall be regarded as confidential information belonging to that member and will not be disclosed to any other member.
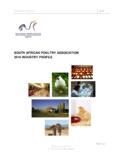
4 3 In March 2019 the breeder flock was expected to comprise million hens; a decrease on December s figure. The average number of breeder hens for January to March of 2019 was forecasted to be million (Graph 3). GRAPH 2: Monthly BROILER breeder flock and average hen age GRAPH 3: Annual average number of BROILER breeder hens ageBroiler breedersMillionsAverage BROILER breeder flockLaying cycle : 20 to 61 weeks of ageAverage breeders per monthAverage flock ageParent flock Mar 2019 Breeder hensMillionsYearAverage BROILER breeders per annum 4 2. BROILER CHICK PLACEMENTS Actual placement: BROILER hatcheries produced million day-old chicks per week in December 2018 (Graph 4, dotted line). Compared to November 2018 this was an increase of million chicks (+ ). Compared to December 2017 this was an increase of million chicks (+ ). In total million BROILER chicks were hatched during the month under review.
5 Annual BROILER chick placements, from 2014 to 2018, are shown in Graph 5. INDUSTRY Potential: Based on the forecasting model, potential PRODUCTION of million BROILER chicks per week was projected for December 2018. Actual PRODUCTION per week was million chicks (+ ) higher than the potential figure (Graph 4). GRAPH 4: Day-old chick placements per week Note: Actual placements (the dashed trend line) show to December 2018; potential placements (based on the forecasting model) are given to March 2019. chicksMillionsBroiler chick placements per week (Breeder cycle : 20 to 61 weeks of age)Forecast based on parents placedActual BROILER chicks hatched 5 GRAPH 5: Actual BROILER chicks placed per annum 3. BROILER PRODUCTION Actual PRODUCTION : On average, million broilers were produced per week in December 2018 (Graph 6). This was million birds ( ) less than the previous month and million birds (+ ) more than the same month of the previous year.
6 In total million broilers were produced for slaughter in the month under review. Annual BROILER PRODUCTION , from 2014 to 2018, is shown in Graph 7. Annual average PRODUCTION per week for the same period is illustrated in Graph 8. INDUSTRY Potential: Potentially million broilers per week were projected for slaughter in December 2018. Actual PRODUCTION per week was less. 0001 0101 0201 0301 0401 0501 06020142015201620172018 BROILER chicks placedMillionsYearActual BROILER chicks placed(million per annum) 6 GRAPH 6: Average number of broilers slaughtered per week GRAPH 7: The total number of broilers slaughtered per annum per weekMillionsWeekly BROILER PRODUCTION per monthForecast based on parents placedBased on actual BROILER chicks broilersMillionsYearAnnual BROILER PRODUCTION (based on actual BROILER chicks placed) 7 Note: Graphs 7 and 8 reflect actual, not potential PRODUCTION , and must therefore be viewed in conjunction with the dashed trend line on Graph 6.
7 GRAPH 8: Average weekly PRODUCTION per annum 4. BROILER AND BREEDER MEAT PRODUCTION The forecasting model predicted 2 800 tonnes would result from the culling of breeder hens and cocks in December 2018. This was 230 tonnes ( ) less than November 2018, and 240 tonnes (+ ) more than December 2017. Actual tonnes of BROILER meat produced in December 2018 was 129 900. This was a month-on-month decrease of 12 100 tonnes ( ), and a year-on-year increase of 3 300 tonnes (+ ). Actual PRODUCTION was 7 700 tonnes ( ) less than that which was predicted by the forecasting model for December 2018. BROILER and breeder meat combined resulted in 132 600 tonnes in December 2018. Graph 9 compares potential (dotted line) to actual BROILER meat PRODUCTION . All breeder sales are assumed to be live, whilst a BROILER slaughter weight of kg, revised from kg in July 2015, was used. Total BROILER meat PRODUCTION includes all saleable offal but excludes brine.
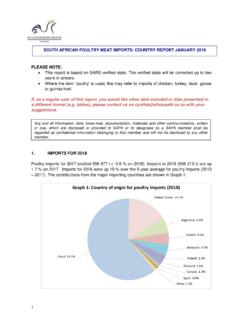
8 ProducedMillionsYearAverage BROILER PRODUCTION per week(based on actual BROILER chicks placed) 8 GRAPH 9: Monthly meat PRODUCTION of broilers and breeders 5. BROILER VOLUME AND PRICE Graph 10 shows the relationships between year-on-year changes in volumes, producer price and the PPI deflated price. A % change > 0 indicates growth in the current month compared to the same month of the previous year. It must be pointed out that the PPI, as published by STATS SA and used to calculate the deflated price, is an indicator of the general change in PRODUCTION costs in South Africa, not specifically poultry costs. The PPI deflated price (the red dotted line on Graph 10) is a measure of real producer price increases without the effect of inflation. and breeder meat productionActual - BroilersPotential - BreedersPotential - broilers 9 GRAPH 10: Year on year % change in supply and price 6.
9 DEPOPULATION OF LAYERS Graph 11 shows the number of BROILER breeder hens expected to be culled on a monthly basis. In March 2019, 632 600 old hens were predicted to be depopulated from BROILER breeder farms. GRAPH 11: Monthly depopulation of BROILER parent hens at 61 weeks of age Change% Change in actual BROILER PRODUCTION and BROILER price(variation on same month of previous year)% change in volume% change in producer price (including offal)% change in PPI deflated price60672566670162863357267556771873356 5420445470495520545570595620645670695720 Oct 18 Nov18/5wkDec 18 Jan19/5wkFeb 19 Mar 19 Apr 19 May19/5wkJun 19 Jul 19 Aug19/5wkSep 19 Hens per monthThousandsTotal BROILER parent hens depopulated per month(4 or 5 weeks per month) 10 7. FEED USAGE The estimated feed tonnages for December 2018 are as follows: BROILER breeder rearing: 8 200 tonnes; BROILER breeder laying: 34 200 tonnes; BROILER : 242 900 tonnes.
10 Graph 12 shows the estimated annual consumption of BROILER feed. GRAPH 12: Annual feed consumed by broilers (tonnes)MillionsYearBroiler feed usageDisclaimer: The views expressed in SAPA STATS reports reflect those of SAPA in collaboration with its independent consultants and do not constitute any specific advice as to decisions or actions that should be taken. While every care has been taken in preparing documents no representation nor warranty or any expressed or implied undertaking is given and no responsibility or liability is accepted by SAPA as to the accuracy or completeness of the information contained herein whether as electronic data or as a finished report . SAPA or its independent consultants do not accept responsibility or liability for any damages of whatsoever nature which any person may suffer as a result of any decision or action taken on the basis of the information contained herein.