Transcription of Tire Product Knowledge Power Point - …
1 K + M TireK + M TireTIRE PRODUCTKNOWLEDGE Just the Facts! TIRE PRODUCTKNOWLEDGE Just the Facts! TIRE FUNCTIONSTIRE FUNCTIONS Carry the Vehicle s Weight and Load Transmit Acceleration Forces Transmit Braking Forces Transmit Cornering Forces Cushion Road Irregularities Provide Durability Carry the Vehicle s Weight and Load Transmit Acceleration Forces Transmit Braking Forces Transmit Cornering Forces Cushion Road Irregularities Provide DurabilityTIRE SPECIFICATIONSTIRE SPECIFICATIONSALL-SEASON TREAD DESIGN M+S DESIGNATIONALL-SEASON TREAD DESIGN M+S DESIGNATIONMOUNTAIN / SNOWFLAKE PICTOGRAPHMOUNTAIN / SNOWFLAKE PICTOGRAPHSAFETY WARNINGSAFETY WARNINGA symmetric Tread DesignAsymmetric Tread DesignInsideInsideOutsideOutsideASYMMETR IC TREAD MOUNTAING INSTRUCTIONSASYMMETRIC TREAD MOUNTAING INSTRUCTIONSD irectional Tread DesignDirectional Tread DesignTwo Examples of What to Look ForTwo Examples of What to Look ForDIRECTION OF TIRE ROTATIONDIRECTION OF TIRE ROTATIONMAX LOAD 990 kg (2183) LBSAT 340 kPa (50 PSI)
2 MAX. LOAD 990 kg (2183) LBSAT 340 kPa (50 PSI) MAX. LOADEXTRA LOADEXTRA LOAD IDENTIFICATIONEXTRA LOAD IDENTIFICATIONE xamples of UTQG on Sidewall Treadwear Traction TemperatureExamples of UTQG on Sidewall Treadwear Traction TemperatureUNIFORM TIRE QUALITY GRADING (UTQG)UNIFORM TIRE QUALITY GRADING (UTQG) Assigned by Manufacturers; They re NOTA ssigned by the Government Use Only to Compare Same Brand Tires of Same Construction Type Treadwear Ratings Are Not Mileage Guarantees or Even Tire Life Predictions Cannot Compare Brands on Basis of UTQG Ratings UTQG Ratings Alone Are Not Indicators of a Tire s Overall Quality and Safety Assigned by Manufacturers; They re NOTA ssigned by the Government Use Only to Compare Same Brand Tires of Same Construction Type Treadwear Ratings Are Not Mileage Guarantees or Even Tire Life Predictions Cannot Compare Brands on Basis of UTQG Ratings UTQG Ratings Alone Are Not Indicators of a Tire s Overall Quality and SafetyINTERPRETING UTQG RATINGSINTERPRETING UTQG RATINGSB ridgestoneItem # B20178 BridgestoneItem # B20178 FirestoneItem # F20243 FirestoneItem # F20243 Mail to:Bridgestone/Firestone Registration CenterC/O CIMS Tire Registration CenterP.
3 O. Box 3636 Akron, Ohio 44309-3636 Mail to:Bridgestone/Firestone Registration CenterC/O CIMS Tire Registration CenterP. O. Box 3636 Akron, Ohio 44309-3636 Associate BrandsItem # 815-2238 Associate BrandsItem # 815-2238 TIRE REGISTRATIONTIRE REGISTRATION Passenger Economy Mass Market Premium Mass Market Touring Performance Performance High Performance Ultra-High Performance Passenger Economy Mass Market Premium Mass Market Touring Performance Performance High Performance Ultra-High PerformancePRODUCT CATEGORIES:PASSENGER VEHICLESPRODUCT CATEGORIES:PASSENGER VEHICLESB eltsTreadBeadsBead FillerInner LinerCord BodySidewallShoulderInsertsPARTS OF A TIREPARTS OF A TIRET readBelt EdgeWedgesInnerLinerBeadFillerBeadsCord BodySidewallBeltsSpiral WrapCap LayerPARTS OF A PERFORMANCE TIREPARTS OF A PERFORMANCE TIRERIBSGROOVESCROSSSLOTSSIPESPARTS OF A TIREPARTS OF A TIRETIRE DIMENSIONSTIRE DIMENSIONS75%Tread Width95%Tread Width100% Section Width100% Section WidthTREAD-WIDTH TO SECTION-WIDTH RATIOTREAD-WIDTH TO SECTION-WIDTH RATIOS izing System Examples: P-Metric P225/60R16 97S Euro-Metric 225/60R16 97 SSizing System Examples.
4 P-Metric P225/60R16 97S Euro-Metric 225/60R16 97 SSIZING NOMENCLATURESSIZING NOMENCLATURESP Passenger Tire225 Section Width in Millimeters60 Aspect RatioRRadial16 Rim Diameter in Inches97 Load IndexS Speed RatingP Passenger Tire225 Section Width in Millimeters60 Aspect RatioRRadial16 Rim Diameter in Inches97 Load IndexS Speed RatingP-METRIC SIZEP-METRIC SIZE225 Section Width in Millimeters60 Aspect RatioRType of Construction16 Rim Diameter in Inches97 Load IndexSSpeed Rating225 Section Width in Millimeters60 Aspect RatioRType of Construction16 Rim Diameter in Inches97 Load IndexSSpeed RatingEURO-METRIC SIZEEURO-METRIC SIZEType of Sizing SystemLoad DesignationMax. Permissible Inflation Pressure MarkingCorresponding Maximum Load Carrying Capacity @P-Metric LL Light Load 35, 44 or 51 35 SL Standard Load35, 44 or 51 35 XL Extra Load41 or 50 RANGE AND INFLATION LIMITSLOAD RANGE AND INFLATION LIMITSType of Sizing SystemLoad DesignationMax.
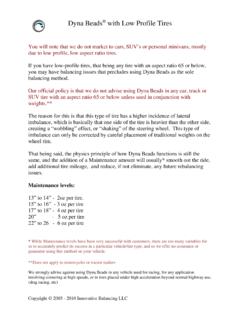
5 Permissible Inflation Pressure MarkingCorresponding Maximum Load Carrying Capacity @Euro-MetricStandard32 or 44 36 Reinforced 51 RANGE AND INFLATION LIMITSLOAD RANGE AND INFLATION LIMITSLIlbs09911027073971761727837380574 8277585376882779087893779963809928110198 2104783107484110285113586116887120288123 5891279901323911356921389931433941477951 5219615659716099816539917091001764101181 9102187410319291041984105203910620941072 1491082205109227111023371112403112246911 3253511426011152679116275611728331182910 1192998120308612131971223307123341712435 271253638276 275575277 283291278 291007279 299826 LIlbsLIlbsLIlbsLOAD INDEX CHARTLOAD INDEX CHARTLOAD AND INFLATION TABLELOAD AND INFLATION TABLE One Pound of Under-Inflation Costs Consumers 2-3 Miles of Gas per Gallon This Wastes 4 Million Gallons of Gas per Day Nationwide Tire Life Is Reduced by 15% More Than Half of the Vehicles in the USA Have Tires That Are Under-Inflated One Pound of Under-Inflation Costs Consumers 2-3 Miles of Gas per Gallon This Wastes 4 Million Gallons of Gas per Day Nationwide Tire Life Is Reduced by 15% More Than Half of the Vehicles in the USA Have Tires That Are Under-InflatedSource: US Department of EnergyTIRE MAINTENANCE FACTSTIRE MAINTENANCE FACTS Nearly 90% of All Drivers Never Check Their Tire Pressure 66% of All Drivers Do Not Even Know Where to Find the Proper Pressure for Their Vehicle Nearly 90% of All Drivers Never Check Their Tire Pressure 66% of All Drivers Do Not Even Know Where to Find the Proper Pressure for Their VehicleSource: Rubber Manufacturer s SurveyTIRE MAINTENANCE FACTSTIRE MAINTENANCE FACTSO verinflation Can Result in: Decreased Traction Reduced Bruise Resistance Premature Wear of Suspension ComponentsOverinflation Can Result in.
6 Decreased Traction Reduced Bruise Resistance Premature Wear of Suspension Components Over-Inflated Tires Will Show Premature TireWear at the Center of the Tread Over-Inflated Tires Will Show Premature TireWear at the Center of the TreadINFLATION PRESSUREINFLATION PRESSURE Under-Inflation of 5 Can Reduce Tire Life by 25% and Decrease Fuel Efficiency by Under-Inflated Tires Will Show Premature Tire Wear on Both Outside Shoulders Under-Inflation of 5 Can Reduce Tire Life by 25% and Decrease Fuel Efficiency by Under-Inflated Tires Will Show Premature Tire Wear on Both Outside ShouldersUnderinflation Can Results in: Sluggish Tire Response Decreased Fuel Economy Excessive Heat Buildup Tire Overload Underinflation Can Results in: Sluggish Tire Response Decreased Fuel Economy Excessive Heat Buildup Tire Overload INFLATION PRESSUREINFLATION PRESSURE Tire Inflation Pressure Carries the Load, but Is Reduced with Time and Temperature Tire Pressure Should Be Checked at Least ONCE a MONTH, BEFORE Long Trips and When Carrying Extra Weight Tires Will Loose ONE (1) POUND of Pressure for Every 10 Change (+ / -) in Ambient Temperature Tire Inflation Pressure Carries the Load, but Is Reduced with Time and Temperature Tire Pressure Should Be Checked at Least ONCE a MONTH, BEFORE Long Trips and When Carrying Extra Weight Tires Will Loose ONE (1) POUND of Pressure for Every 10 Change (+ / -) in Ambient TemperatureSUMMARY:SUMMARY.
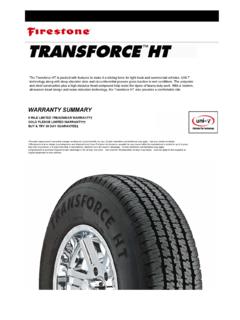
7 You Can Usually Find the Correct Inflation Pressure for Tires on a Sticker on the Driver s Side Door Jamb, in the Glove Compartment, or in the Vehicle Owner s Manual Check the Pressure with a Reliable Tire Gauge When the Tire Is COLD (When the Vehicle Has Been Driven Less Than 1 Mile or Has Not Been Moved for 3 Hours) You Can Usually Find the Correct Inflation Pressure for Tires on a Sticker on the Driver s Side Door Jamb, in the Glove Compartment, or in the Vehicle Owner s Manual Check the Pressure with a Reliable Tire Gauge When the Tire Is COLD (When the Vehicle Has Been Driven Less Than 1 Mile or Has Not Been Moved for 3 Hours)SUMMARY:SUMMARY:FrontWheel DriveRearand FourWheel DriveSix-TireRotationLightTruckTires Should Be Rotated on a Regular Basis to Even Out Wear Rate!Wear Patterns: Front Tires Wear Faster at Both Shoulders Rear Tires Wear Faster in Center Tread AreaThe Following Rotation Patterns Are Normally Recommended for Radial Tires.
8 Some Exceptions to These Patterns May ROTATIONTIRE ROTATIONS peed RatingsGive an Indicationof a Tire s PerformanceSpeed RatingsGive an Indicationof a Tire s PerformanceSPEED RATINGSSPEED RATINGSP225/60R16 97SP225/60R16 97S97 = Load Index97 = Load IndexS = Speed RatingS = Speed RatingSERVICE DESCRIPTIONSERVICE DESCRIPTIONQ Up to 99 mphR Up to 106 mphS Up to 112 mphT Up to 118 mphU Up to 124 mphH Up to 130 mphV Up to 149 mphZ Over 149 mphW Up to 168 mphY Up to 186 mphQ Up to 99 mphR Up to 106 mphS Up to 112 mphT Up to 118 mphU Up to 124 mphH Up to 130 mphV Up to 149 mphZ Over 149 mphW Up to 168 mphY Up to 186 mphSPEED RATINGSSPEED RATINGSI nflate All Tires toManufacturer s RecommendedInflation PressureANDHand Torque Lug Nutsto Manufacturer sRecommended SpecificationsInflate All Tires toManufacturer s RecommendedInflation PressureANDHand Torque Lug Nutsto Manufacturer sRecommended SpecificationsTHANK YOU!