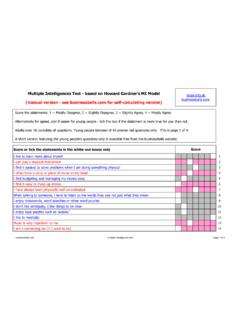
Transcription of Tools & Techniques for Process Improvement - …
1 ToFromExcellenceQualityUnderstanding processes so that they can be improved by means of a systematic approach requires theknowledge of a simple kit of Tools or Techniques . The effective use of these Tools and Techniques requirestheir application by the people who actually work on the processes, and their commitment to this will onlybe possible if they are assured that management cares about improving quality. Managers must show theyare committed by providing the training and implementation support Tools and Techniques most commonly used in Process Improvement are.
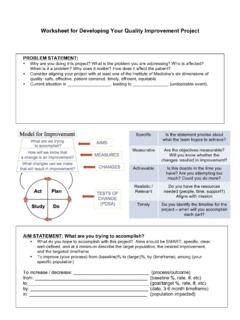
2 Problem solving methodology, such as DRIVE Process mapping Process flowcharting Force field analysis Cause & effect diagrams CEDAC Brainstorming Pareto analysis Statistical Process control (SPC) Control charts Check sheets Bar charts Scatter diagrams Matrix analysis Dot plot or tally chart HistogramsDRIVEis an approach to problem solving and analysis that can be used as part of Process scope of the problem the criteria by which success will be measured andagree the deliverables and success factorsReviewthe current situation, understand the background, identify and collect information,including performance, identify problem areas, improvements and quick wins Identifyimprovements or solutions to the problem.
3 Required changes to enable andsustain the improvementsVerifycheck that the improvements will bring about benefits that meet the definedsuccess criteria, prioritise and pilot the improvementsExecuteplan the implementation of the solutions and improvements, agree and implementthem, plan a review, gather feedback and reviewTools & Techniques for Process 1 of 8toFromExcellenceQualityOne of the initial steps to understand or improve a Process is Process Mapping. By gathering informationwe can construct a dynamic model - a picture of the activities that take place in a Process .
4 Process mapsare useful communication Tools that help Improvement teams understand the Process and identifyopportunities for (inputs, outputs, controls and resources) is an internationally accepted Process analysis methodologyfor Process mapping. It allows processes to be broken down into simple, manageable and more easilyunderstandable units. The maps define the inputs, outputs, controls and resources for both the high levelprocess and the 2 of 8 Process mapping provides a common framework, discipline and language, allowing a systematic way ofworking.
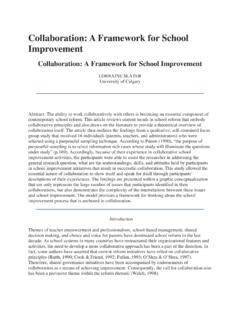
5 Complex interactions can be represented in a logical, highly visible and objective way. It defineswhere issues or pinch points exist and provides Improvement teams with a common decision construct a Process map: Brainstorm all activities that routinely occur within the scope of the Process Group the activities into 4-6 key sub-processes Identify the sequence of events and links between the sub-processes Define as a high level Process map and sub- Process maps using ICORP rocess maps provide a dynamic view of how an organisation can deliver enhanced business value.
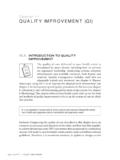
6 What if scenarios can be quickly developed by comparing maps of the Process As is with the Process To be .toFromExcellenceQualityProcessControlsI nputsStandardsProcedureCapacityOutputsCu stomersResourcesInternalPhysicalMechanic alMachineSiteKnowledgeSkills &experienceComputerServiceProductExterna lHumanRaw materialsDataSuppliesRegulatorsRegulator sRequirementsLegislationAnother tool used in the construction of Process maps isProcess Flowcharting. This is a powerfultechnique for recording, in the form of a picture, exactly what is done in a Process .
7 3 of 8 StartProcess step(operation)DecisionInformationblockE ndFlowRecordsThere are certain standard symbols used in classic flowcharts, and these are:If a flowchart cannot be drawn using these symbols, then the Process is not fully understood. The purposeof the flowchart is to learn why the current Process operates the way it does and to conduct an objectiveanalysis, to identify problems and weaknesses, unnecessary steps or duplication and the objectives of theimprovement Field Analysisis a technique for identifying forces which may helpor hinder achieving a change or Improvement .
8 By assessing the forcesthat prevent making the change, plans can be developed to overcomethem. It is also important to identify those forces that will help with thechange. Once these forces have been identified and analysed, it ispossible to determine if a proposed change is EffectFactors or ConcernsRestrainingforcesThe effect or problem beinginvestigated is shown at theend of a horizontal arrow;potential causes are thenshown as labelled arrowsentering the main cause arrow may have otherarrows entering it as theprincipal causes or factors arereduced to their sub-causes.
9 Brainstorming can beeffectively used to generatethe causes and 4 of 8A useful way of mapping the inputs that effect quality is the Cause & Effect Diagram, also know as theFishboneor Ishikawa Diagram. It is also a useful technique for opening up thinking in problem be used in conjunction with the Cause and Effect tool. It is a group technique used togenerate a large number of ideas quickly and may be used in a variety of situations. Each member of thegroup, in turn, can put forward an idea concerning the problem being considered. Wild ideas are welcomedand no criticism or evaluation occurs during brainstorming, all ideas being recorded for subsequent Process continues until no further ideas are forthcoming and increases the chance for originality andinnovation.
10 It can be used for: Identifying problem areas Identifying areas for Improvement Designing solutions to problems Developing action plansPareto Analysiscan be used to analyse the ideas from abrainstorming session. It is used to identify the vital fewproblems or causes of problems that have the greatestimpact. A Pareto diagram or chart pictorially representsdata in the form of a ranked bar chart that shows thefrequency of occurrence of items in descending , Pareto diagrams reveal that 80% of the effect isattributed to 20% of the causes; hence, it is some-timesknown as the 80/20 5 of 8 With CEDAC Cause and Effect Diagram with the Addition of Cards, the effect side of the diagram is aquantified description of the problem, and the cause side of the diagram uses two different coloured cardsfor writing the factsand the ideas.