Transcription of Topic 15: Maximum Likelihood Estimation
1 Topic 15: Maximum Likelihood Estimation . November 1 and 3, 2011. 1 Introduction The principle of Maximum Likelihood is relatively straightforward. As before, we begin with a sample X =. (X1 , .. , Xn ) of random variables chosen according to one of a family of probabilities P . In addition, f (x| ), x = (x1 , .. , xn ) will be used to denote the density function for the data when is the true state of nature. Then, the principle of Maximum Likelihood yields a choice of the estimator as the value for the parameter that makes the observed data most probable. Definition 1. The Likelihood function is the density function regarded as a function of . L( |x) = f (x| ), . (1). The Maximum Likelihood estimator (MLE), (x) = arg max L( |x). (2).. We will learn that especially for large samples, the Maximum Likelihood estimators have many desirable properties.
2 However, especially for high dimensional data, the Likelihood can have many local maxima. Thus, finding the global Maximum can be a major computational challenge. This class of estimators has an important property. If (x) is a Maximum Likelihood estimate for , then g( (x)). is a Maximum Likelihood estimate p for g( ). For example, if is a parameter for the variance and is the Maximum Likelihood estimator, then is the Maximum Likelihood estimator for the standard deviation. This flexibility in Estimation criterion seen here is not available in the case of unbiased estimators. Typically, maximizing the score function, ln L( |x), the logarithm of the Likelihood , will be easier. Having the parameter values be the variable of interest is somewhat unusual, so we will next look at several examples of the Likelihood function.
3 2 Examples Example 2 (Bernoulli trials). If the experiment consists of n Bernoulli trial with success probability p, then L(p|x) = px1 (1 p)(1 x1 ) pxn (1 p)(1 xn ) = p(x1 + +xn ) (1 p)n (x1 + +xn ) . n X n X. ln L(p|x) = ln p( xi ) + ln(1 p)(n xi ) = n(x ln p + (1 x ) ln(1 p)). i=1 i=1.. x 1 x x p ln L(p|x) = n =n p p 1 p p(1 p). This equals zero when p = x . c 2011 Joseph C. Watkins 182. Introduction to Statistical Methodology Maximum Likelihood Estimation Exercise 3. Check that this is a Maximum . Thus, p (x) = x . In this case the Maximum Likelihood estimator is also unbiased. Example 4 (Normal data). Maximum Likelihood Estimation can be applied to a vector valued parameter. For a simple random sample of n normal random variables, we can use the properties of the exponential function to simplify the Likelihood function.
4 N (x1 )2 (xn )2.. 1 1 1 1 X. L( , 2 |x) = exp exp = exp (xi )2 . 2 2 2 2 2 2 i=1. p 2 2 2 2 (2 2 )n The score function n n 1 X. ln L( , 2 |x) = (ln 2 + ln 2 ) 2 (xi )2 . 2 2 i=1. n 1 X 1. ln L( , 2 |x) = 2 (xi ) = . 2 n(x ). i=1 . Because the second partial derivative with respect to is negative, (x) = x . is the Maximum Likelihood estimator. For the derivative of the score function with respect to the parameter 2 , n n ! 2 n 1 X 2 n 2 1X 2. ln L( , |x) = 2 + (xi ) = (xi ) . 2 2 2( 2 )2 i=1 2( 2 )2 n i=1. Recalling that (x) = x , we obtain n 1X. 2 (x) = (xi x )2 . n i=1. Note that the Maximum Likelihood estimator is a biased estimator. Example 5 (Lincoln-Peterson method of mark and recapture). Let's recall the variables in mark and recapture: t be the number captured and tagged, k be the number in the second capture, r the the number in the second capture that are tagged, and let N be the total population.
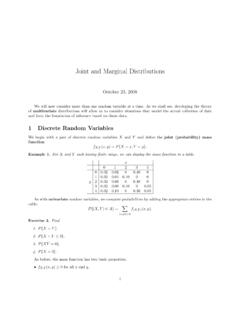
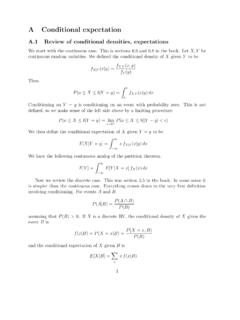
5 Here t and k is set by the experimental design; r is an observation that may vary. The total population N is unknown. The Likelihood function for N is the hypergeometric distribution. t N t . r k r L(N |r) = N.. k We would like to maximize the Likelihood given the number of recaptured individuals r. Because the domain for N. is the nonnegative integers, we cannot use calculus. However, we can look at the ratio of the Likelihood values for successive value of the total population. L(N |r). L(N 1|r). 183. Introduction to Statistical Methodology Maximum Likelihood Estimation l l +00 +00. p p -14. -27. -16. -29. log(l). log(l). -18. -31. -20. -33. p p Figure 1: Likelihood function (top row) and its logarithm, the score function, (bottom row) for Bernouli trials. The left column is based on 20 trials having 8 and 11 successes.
6 The right column is based on 40 trials having 16 and 22 successes. Notice that the Maximum Likelihood is approximately 10 6 for 20 trials and 10 12 for 40. In addition, note that the peaks are more narrow for 40 trials rather than 20. We shall later be able to associate this property to the variance of the Maximum Likelihood estimator. 184. Introduction to Statistical Methodology Maximum Likelihood Estimation N is more likely that N 1 precisely when this ratio is larger than one. The computation below will show that this ratio is greater than 1 for small values of N and less than one for large values. Thus, there is a place in the middle which has the Maximum . We expand the binomial coefficients in the expression for L(N |r) and simplify. t N t N. N t N 1. (N t)! (N 1)! L(N |r) r k r / k k r (k r)!
7 (N t k+r)! k!(N k 1)! = t N t 1. = k =. L(N 1|r) / Nk 1 N t 1 N (N t 1)! . N! r k r k r k (k r)!(N t k+r 1)! k!(N k)! (N t)!(N 1)!(N t k + r 1)!(N k)! (N t)(N k). = = . (N t 1)!N !(N t k + r)!(N k 1)! N (N t k + r). Thus, the ratio L(N |r) (N t)(N k). =. L(N 1|r) N (N t k + r). exceeds 1if and only if (N t)(N k) > N (N t k + r). N tN kN + tk > N 2 tN kN + rN. 2. tk > rN. tk >N. r Writing [x] for the integer part of x, we see that L(N |r) > L(N 1|r) for N < [tk/r] and L(N |r) L(N 1|r). for N [tk/r]. This give the Maximum Likelihood estimator . tk N = . r Thus, the Maximum Likelihood estimator is, in this case, obtained from the method of moments estimator by round- ing down to the next integer. Let look at the example of mark and capture from the previous Topic . There N = 2000, the number of fish in the population, is unknown to us.
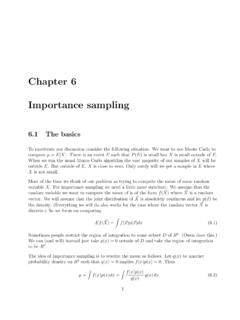
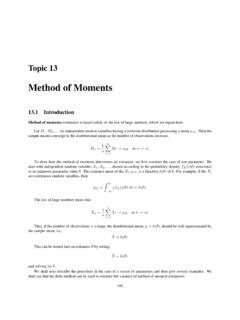
8 We tag t = 200 fish in the first capture event, and obtain k = 400 fish in the second capture. > N<-2000. > t<-200. > fish<-c(rep(1,t),rep(0,N-t)). > k<-400. > r<-sum(sample(fish,k)). > r [1] 42. In this simulated example, we find r = 42 recaptured fish. For the Likelihood function, we look at a range of values for N that is symmetric about 2000. Here, N = [200 400/42] = 1904. > N<-c(1800:2200). > L<-dhyper(r,t,N-t,k). > plot(N,L,type="l",ylab="L(N|42)"). Example 6 (Linear regression). Our data are n observations with one explanatory variable and one response variable. The model is that yi = + xi + i 185. Introduction to Statistical Methodology Maximum Likelihood Estimation Likelihood Function for Mark and Recapture L(N|42). 1800 1900 2000 2100 2200. N. Figure 2: Likelihood function L(N |42) for mark and recapture with t = 200 tagged fish, k = 400 in the second capture with r = 42 having tags and thus recapture.
9 Note that the Maximum Likelihood estimator for the total fish population is N = 1904. where the i are independent mean 0 normal random variables. The (unknown) variance is 2 . Thus, the joint density for the i is n 1 21 1 22 1 2n 1 1 X 2. exp exp exp = exp . 2 2 2 2 2 2 2 2 i=1 i p 2 2 2 2 2 2 (2 2 )n Since i = yi ( + xi ), the Likelihood function n 1 1 X. L( , , 2 |y, x) = p exp 2 (yi ( + xi ))2 . (2 2 )n 2 i=1. The score function n n 1 X. ln L( , , 2 |y, x) = (ln 2 + ln 2 ) 2 (yi ( + xi ))2 . 2 2 i=1. Consequently, maximizing the Likelihood function for the parameters and is equivalent to minimizing n X. SS( . ) = (yi ( + xi ))2 . i=1. Thus, the principle of Maximum Likelihood is equivalent to the least squares criterion for ordinary linear regression. The Maximum Likelihood estimators and give the regression line y i = + xi.
10 Exercise 7. Show that the Maximum Likelihood estimator for 2 is n 2 1X. M LE = (yi y i )2 . n k=1. 186. Introduction to Statistical Methodology Maximum Likelihood Estimation Frequently, software will report the unbiased estimator. For ordinary least square procedures, this is n 2 1 X. U = (yi y i )2 . n 2. k=1. For the measurements on the lengths in centimeters of the femur and humerus for the five specimens of Archeopteryx, we have the following R output for linear regression. > femur<-c(38,56,59,64,74). > humerus<-c(41,63,70,72,84). > summary(lm(humerus femur)). Call: lm(formula = humerus femur). Residuals: 1 2 3 4 5. Coefficients: Estimate Std. Error t value Pr(>|t|). (Intercept) femur **. --- Signif. codes: 0 ** ** * . 1. Residual standard error: on 3 degrees of freedom Multiple R-squared: ,Adjusted R-squared: F-statistic: on 1 and 3 DF, p-value: The residual standard error of centimeters is obtained by squaring the 5 residuals, dividing by 3 = 5 2 and taking a square root.