Transcription of Topic: Spectrogram, Cepstrum and Mel-Frequency Analysis
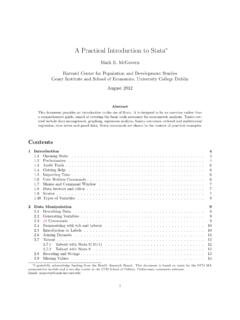
1 Speech Technology - Kishore Prahallad Technology: A practical IntroductionTopic: Spectrogram, Cepstrum and Mel-Frequency AnalysisKishore PrahalladEmail: Mellon University&International Institute of Information Technology HyderabadSpeech Technology - Kishore Prahallad Spectrogram Cepstrum Mel-Frequency Analysis Mel-Frequency Cepstral CoefficientsSpeech Technology - Kishore Prahallad Technology - Kishore Prahallad signal represented as a sequence of spectral vectorsFFTFFTFFTS pectrumSpeech Technology - Kishore Prahallad signal represented as a sequence of spectral vectorsFFTS pectrumFFTFFTFFTFFTFFTFFTFFTFFTFFTFFTFFT FFTFFTS peech Technology - Kishore Prahallad signal represented as a sequence of spectral
2 Technology - Kishore Prahallad signal represented as a sequence of spectral vectorsFFTS pectrumFFTFFTFFTFFTFFTFFTFFTFFTFFTFFTFFT FFTFFTHzAmplitudeRotate it by 90 degreesSpeech Technology - Kishore Prahallad signal represented as a sequence of spectral vectorsFFTS pectrumFFTFFTFFTFFTFFTFFTFFTFFTFFTFFTFFT FFTFFTHz MAP spectral amplitude to a grey level (0-255) value. 0 represents black and 255 represents white. Higher the amplitude, darker the corresponding Technology - Kishore Prahallad signal represented as a sequence of spectral vectorsFFTS pectrumFFTFFTFFTFFTFFTFFTFFTFFTFFTFFTFFT FFTFFTHzTimeSpeech Technology - Kishore Prahallad signal represented as a sequence of spectral vectorsFFTS pectrumFFTFFTFFTFFTFFTFFTFFTFFTFFTFFTFFT FFTFFTHzTimeTime Vs frequency representation of a speech signal is referred to as spectrogramSpeech Technology - Kishore Prahallad Real SpectrogramsDark regions indicate peaks (formants)
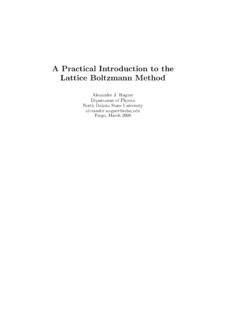
3 In the spectrumSpeech Technology - Kishore Prahallad we are bothered about spectrogramsPhones and their properties are better observed in spectrogramSpeech Technology - Kishore Prahallad we are bothered about spectrogramsSounds can be identified much better by the Formants and by their transitionsSpeech Technology - Kishore Prahallad we are bothered about spectrogramsSounds can be identified much better by the Formants and by their transitionsHidden Markov Models implicitly model these spectrograms to perform speech recognitionSpeech Technology - Kishore Prahallad of Spectrogram Time- frequency representation of the speech signal Spectrogram is a tool to study speech sounds (phones) Phones and their properties are visually studied by phoneticians Hidden Markov Models implicitly model spectrograms for speech totext systems Useful for evaluation of text to speech systems A high quality text to speech system should produce synthesized speech whose spectrograms should nearly match with the natural Technology - Kishore Prahallad AnalysisSpeech Technology - Kishore Prahallad Sample Speech SpectrumFrequency (Hz)
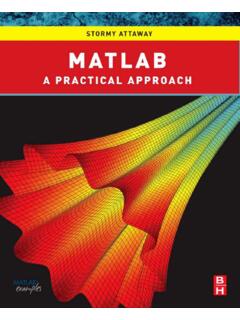
4 DB Peaks denote dominant frequency components in the speech signal Peaks are referred to as formants Formants carry the identity of the soundSpeech Technology - Kishore Prahallad we want to Extract? Spectral Envelope Formants and a smooth curve connecting them This Smooth curve is referred to as spectral envelope frequency (Hz)dBSpeech Technology - Kishore Prahallad EnvelopeSpectral EnvelopeSpectrumSpectral detailsSpeech Technology - Kishore Prahallad EnvelopeSpectral EnvelopeSpectrumSpectral detailslog X[k]log H[k]log E[k]Speech Technology - Kishore Prahallad EnvelopeSpectral EnvelopeSpectrumSpectral detailslog X[k]log H[k]log E[k]log X[k] = log H[k] + log E[k]1.
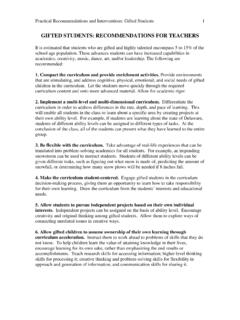
5 Our goal: We want to separate spectral envelope and spectral details from the spectrum . 2. Given log X[k], obtain log H[k] and log E[k], such that log X[k] = log H[k] + log E[k] Speech Technology - Kishore Prahallad to achieve this separation ?Speech Technology - Kishore Prahallad a Mathematical TrickSpectral EnvelopeSpectral detailsSpectrum Trick: Take FFT of the spectrum !! An FFT on spectrum referred to as Inverse FFT (IFFT). Note: We are dealing with spectrum in log domain (part of the trick) IFFT of log spectrum would represent the signal in pseudo- frequency axisSpeech Technology - Kishore Prahallad a Mathematical TrickSpectral EnvelopeA pseudo- frequency axisSpectral detailsSpectrumSpeech Technology - Kishore Prahallad a Mathematical TrickSpectral EnvelopeSpectrumSpectral detailsA pseudo- frequency axisLow Freq.
6 RegionHigh Freq. regionSpeech Technology - Kishore Prahallad a Mathematical TrickSpectral EnvelopeSpectrumSpectral detailsA pseudo- frequency axisLow Freq. regionHigh Freq. regionIFFTS peech Technology - Kishore Prahallad a Mathematical TrickSpectral EnvelopeSpectrumSpectral detailsA pseudo- frequency axisLow Freq. regionHigh Freq. regionIFFTT reat this as a sine wave with 4 cycles per Technology - Kishore Prahallad a Mathematical TrickSpectral EnvelopeSpectrumSpectral detailsA pseudo- frequency axisLow Freq. regionHigh Freq. regionIFFTT reat this as a sine wave with 4 cycles per a peak at 4 Hz in frequency axisSpeech Technology - Kishore Prahallad a Mathematical TrickSpectral EnvelopeSpectrumSpectral detailsA pseudo- frequency axisLow Freq.
7 RegionHigh Freq. regionIFFTT reat this as a sine wave with 4 cycles per a peak at 4 Hz in frequency axisSpeech Technology - Kishore Prahallad a Mathematical TrickSpectral EnvelopeSpectrumSpectral detailsA pseudo- frequency axisLow Freq. regionHigh Freq. regionIFFTS peech Technology - Kishore Prahallad a Mathematical TrickSpectral EnvelopeSpectrumSpectral detailsA pseudo- frequency axisLow Freq. regionHigh Freq. regionIFFTT reat this as a sine wave with 100 cycles per a peak at 100 Hz in frequency axisSpeech Technology - Kishore Prahallad a Mathematical TrickSpectral EnvelopeSpectrumSpectral detailsA pseudo- frequency axisLow Freq.
8 RegionHigh Freq. regionIFFTIFFTS peech Technology - Kishore Prahallad a Mathematical TrickSpectral EnvelopeSpectrumSpectral detailsA pseudo- frequency axisSpeech Technology - Kishore Prahallad a Mathematical TrickSpectral EnvelopeSpectrumSpectral detailsA pseudo- frequency axisIFFTlog X[k] = log H[k] + log E[k]log H[k]log E[k]Speech Technology - Kishore Prahallad a Mathematical TrickSpectral EnvelopeSpectrumSpectral detailsA pseudo- frequency axisIFFTlog X[k] = log H[k] + log E[k]log H[k]log E[k]x[k] = h[k] + e[k]Speech Technology - Kishore Prahallad a Mathematical TrickSpectral EnvelopeSpectrumSpectral detailsA pseudo- frequency axisIFFTlog X[k] = log H[k] + log E[k]log H[k]log E[k]x[k] = h[k] + e[k]In practice all you have access to only log X[k] and hence you can obtain x[k]Speech Technology - Kishore Prahallad a Mathematical TrickSpectral EnvelopeSpectrumSpectral detailsA pseudo- frequency axisIFFTlog X[k] = log H[k] + log E[k]log H[k]log E[k]x[k] = h[k] + e[k]If you know x[k] Filter the low frequency region to get h[k]
9 Speech Technology - Kishore Prahallad a Mathematical TrickSpectral EnvelopeSpectrumSpectral detailsA pseudo- frequency axisIFFTlog X[k] = log H[k] + log E[k]log H[k]log E[k]x[k] = h[k] + e[k] x[k] is referred to as Cepstrum h[k] is obtained by considering the low frequency region of x[k]. h[k] represents the spectral envelope and is widely used as feature for speech recognition Speech Technology - Kishore Prahallad Analysis ][][][sidesboth on FFTinverseTaking||][||log||][||log||][|| logsidesboth on Log Takemagnitude denotes||.||||][||||][||||][||][][][kekh kxkEkHkXkEkHkXkEkHkX+=+= ==Speech Technology - Kishore Prahallad AnalysisSpeech Technology - Kishore Prahallad What we did We captured spectral envelope (curve connecting all formants) BUT.
10 Perceptual experiments say human ear concentrates on certain regions rather than using whole of the spectral (Hz)dBSpeech Technology - Kishore Prahallad Analysis Mel-Frequency Analysis of speech is based on human perception experiments It is observed that human ear acts as filter It concentrates on only certain frequency components These filters are non-uniformly spaced on the frequency axis More filters in the low frequency regions Less no. of filters in high frequency regionsSpeech Technology - Kishore Prahallad FiltersSpeech Technology - Kishore Prahallad FiltersMore no.