Transcription of Total Bond Market ETF - The Vanguard Group
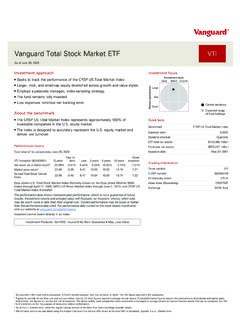
1 Vanguard Vanguard Total Bond Market ETF BND As of March 31, 2022 Investment approach Seeks to track the performance of the Bloomberg Aggregate Float Adjusted Index. Passively managed using index sampling. Broad exposure to the taxable investment-grade dollar-denominated bond Market , excluding inflation-protected and tax-exempt bonds. Intermediate-duration portfolio. Provides moderate current income with high credit quality. About the benchmark The Bloomberg Aggregate Float Adjusted Index is a rules-based index that measures the investment return of investment-grade, taxable, fixed income securities in the United States including government, corporate, and international dollar-denominated bonds, as well as mortgage-backed and asset-backed securities all with maturities longer than 1 year.
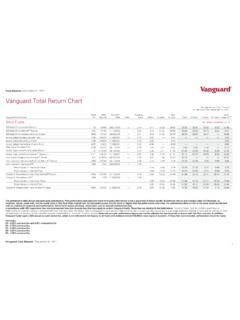
2 The average maturity is between 5 and 10 years. Performance history Total returns 2 for period ended March 31, 2022 BND (Inception 04/03/2007) Quarter Year to date 1 year 3 years 5 years 10 years Since inception Net asset value (NAV) return Market price return Spliced Bloomberg Aggregate Float Adjusted Index Bloomberg Aggregate Bond Index through December 31, 2009; Bloomberg Aggregate Float Adjusted Index thereafter. The performance data shown represent past performance, which is not a guarantee of future results. Investment returns and principal value will fluctuate, so investors shares, when sold, may be worth more or less than their original cost.
3 Current performance may be lower or higher than the performance data cited. For performance data current to the most recent month-end, visit our website at . The performance of an index is not an exact representation of any particular investment, as you cannot invest directly in an index. Investment Products: Not FDIC Insured No Bank Guarantee May Lose Value Investment focus ShortDurationQualityLongMediumTrsy/AgcyI nv Grd CorpBelowInvGrdCentral tendency Expected range of fund holdings Quick facts Benchmark Bloomberg Aggregate Float Adjusted Index Expense ratio Dividend schedule Monthly ETF Total net assets $83,405 million Fund Total net assets $297,886 million Inception date April 3, 2007 Trading information Ticker symbol BND CUSIP number 921937835 IIV (intra-day ticker) Index ticker (Bloomberg)
4 I20984US Exchange NASDAQ ETF attributes Total Bond Market ETF Bloomberg Aggregate Float Adjusted Index Number of bonds 10,153 12,538 Average duration years years Average effective maturity years years Turnover rate short -term reserves 1. As reported in the most recent prospectus. A fund s current expense ratio may be lower or higher than the figure reported in the prospectus. 2. Figures for periods of less than one year are cumulative returns. All other figures represent average annual returns. Fund performance figures assume the reinvestment of dividends and capital gains distributions; the figures are pre-tax and net of expenses.
5 The above widely used comparative index represents unmanaged or average returns on various financial assets that can be compared with the fund s Total returns for the purpose of measuring relative performance. 3. As of 4 , Eastern time, when the regular trading session of the New York Stock Exchange typically closes. 4. Market price returns are calculated using the midpoint between the bid and offer prices at the time NAV is calculated, typically 4 , Eastern time. 5. For most recent fiscal year. Turnover rate excludes the value of portfolio securities received or delivered as a result of in-kind purchases or redemptions of the fund s capital shares, including Vanguard ETF Creation Units.
6 Vanguard Total Bond Market ETF BND As of March 31, 2022 Expense ratio comparison 1 Core Bond Funds Average Core Bond Funds Average ETFs only Total Bond Market ETF Distibution by effective maturity Under 1 Year %1 - 5 Years %5 - 10 Years %10 - 15 Years %15 - 20 Years %20 - 25 Years %Over 25 Years %Distribution by issuer Asset-Backed %Commercial Mortgage-Backed %Finance %Foreign %Government Mortgage-Backed %Industrial %Treasury/Agency %Utilities %Other %Distribution by credit quality Government %Aaa %Aa % %Baa %Less than BBB %Not Rated %1.
7 Represents the expense ratio for the Vanguard ETF as reported in the most recent prospectus. There are material differences between mutual funds and ETFs. Unlike mutual funds, ETFs are priced continuously and bought and sold throughout the day in the secondary Market (at a premium or discount to net asset value) with the assistance of a stockbroker, which entails paying commissions. Sources: Lipper, a Thomson Reuters Company, and Vanguard , December 31, 2021. 2. Credit-quality ratings are measured on a scale that generally ranges from AAA (highest) to D (lowest). NR is used to classify securities for which a rating is not available.
8 NR securities may include a fund s investment in Vanguard Market Liquidity Fund or Vanguard Municipal Cash Management Fund, each of which invests in high-quality money Market instruments and may serve as a cash management vehicle for the Vanguard funds, trusts, and accounts. Treasury, Agency, and Agency mortgage-backed securities appear under Government. Credit-quality ratings for each issue are obtained from Bloomberg using ratings derived from Moody s Investors Service (Moody s), Fitch Ratings (Fitch), and Standard & Poor s (S&P). When ratings from all three agencies are available, the median rating is used.
9 When ratings are available from two of the agencies, the lower rating is used. When one rating is available, that rating is used. Vanguard ETF Shares are not redeemable with the issuing Fund other than in very large aggregations worth millions of dollars. Instead, investors must buy or sell Vanguard ETF Shares in the secondary Market and hold those shares in a brokerage account. In doing so, the investor may incur brokerage commissions and may pay more than net asset value when buying and receive less than net asset value when selling. All ETF products are subject to risk, which may result in the loss of principal.
10 Investments in bond ETF products are subject to interest rate, credit, and inflation risk. BLOOMBERG is a trademark and service mark of Bloomberg Finance Bloomberg Finance and its affiliates, including Bloomberg Index Services Limited ( BISL ) (collectively, Bloomberg ), or Bloomberg s licensors own all proprietary rights in the Bloomberg Indices. The products are not sponsored, endorsed, issued, sold or promoted by Bloomberg. Bloomberg makes no representation or warranty, express or implied, to the owners or purchasers of the products or any member of the public regarding the advisability of investing in securities generally or in the products particularly or the ability of the Bloomberg Indices to track general bond Market performance.