Transcription of Tracking Trends in Health system performance
1 The mission of The Commonwealth Fund is to promote a high performance Health care system . The Fund carries out this mandate by supporting independent research on Health care issues and making grants to improve Health care practice and policy. Support for this research was provided by The Commonwealth Fund. The views presented here are those of the authors and not necessarily those of The Commonwealth Fund or its directors, officers, or Trends in Health system performanceFor more information about this brief, please contact:Sara R. Collins, President, Health Care Coverage and AccessThe Commonwealth learn more about new publications when they become available, visit the Fund s website and register to receive email Fund pub. 1883 Vol. 17 Americans Experiences with ACA Marketplace Coverage: affordability and Provider Network SatisfactionFindings from the Commonwealth Fund Affordable Care Act Tracking Survey, February April 2016 Munira Z.
2 Gunja, Sara R. Collins, Michelle M. Doty, and Sophie BeutelAbstract For people with low and moderate incomes, the Affordable Care Act s tax credits have made premium costs roughly comparable to those paid by people with job-based Health insurance. For those with higher incomes, the tax credits phase out, meaning that adults in marketplace plans on average have higher premium costs than those in employer plans. The law s cost-sharing reductions are reducing deduct-ibles. Lower-income adults in marketplace plans were less likely than higher-income adults to report having deductibles of $1,000 or more. Majorities of new market-place enrollees and those who have changed plans since they initially obtained mar-ketplace coverage are satisfied with the doctors participating in their plans. Overall, the majority of marketplace enrollees expressed confidence in their ability to afford care if they were to become seriously ill.
3 This issue brief explores these and other findings from the Commonwealth Fund Affordable Care Act Tracking Survey, February April 26 million Americans have Health insurance through the Affordable Care Act s coverage expansions, either through the state or federal mar-ketplaces or through expanded eligibility for Estimates from a recent survey (The Commonwealth Fund s Affordable Care Act Tracking Survey, conducted between February and April 2016) indicate this coverage is improving people s ability to get Health care. Sixty-one percent of respon-dents who were enrolled in marketplace plans or Medicaid said they would not have been able to access or afford their care before they got their new 20162 The Commonwealth FundUsing these survey data, this brief examines the costs of marketplace plans and how consum-ers view the affordability of their Health insurance.
4 We compare premiums and deductibles reported by marketplace enrollees with those reported by adults in employer plans and examine whether these costs have increased over time. We also investigate if enrollees are choosing plans that limit the num-ber of providers offered ( narrow network plans) and the level of consumers satisfaction with the doctors participating in their OF MARKETPLACE PLANSP remium Costs Are Similar in Marketplace Plans and Employer PlansOf the million people enrolled in marketplace plans in 2016, more than eight of 10 are paying for their premiums with the help of federal tax The effect of these tax credits on consumers costs is reflected in this brief s adults with single policies ( , those covering only themselves), those enrolled in marketplace plans reported that the amount they pay for their premiums is similar to what people with employer-based coverage pay.
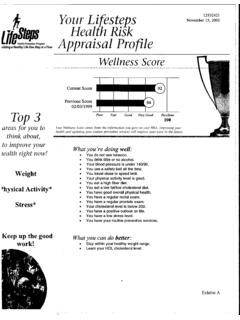
5 Fifty-seven percent of adults in marketplace plans and 60 percent in employer plans spent less than $125 per month on insurance premiums. These figures include the one of five people with either type of insurance who paid nothing (Exhibit 1).4 Most people who purchased marketplace plans were eligible for premium tax credits. Fifty-nine percent of people with marketplace coverage had incomes under 250 percent of the federal poverty level ($29,425 for an individual and $60,625 for a family of four), making them eligible for the most generous premium subsidies (Table 1). As a result, 66 percent of these adults paid less than $125 a month toward their premium, including 26 percent who paid nothing. Among people with Low - Income Adults with Marketplace Coverage Paid Monthly Premiums Comparable to Low- Income Adults with Employer CoverageNotes: FPL refers to federal poverty level.
6 250% of FPL is $29,425 for an individual or $60,625 for a family of four. Segments may not sum to subtotals because of rounding. Bars may not sum to 100 percent because of : The Commonwealth Fund Affordable Care Act Tracking Survey, February April adultsAdults with incomes below 250% FPLA dults with incomes 250% FPL or moreExhibit 1 Source: M. Gunja, S. R. Collins, M. M. Doty, and S. Beutel, Americans Experiences with ACA Marketplace Coverage: affordability and Provider Network Satisfaction,The Commonwealth Fund, July coverageMarketplace coverageEmployer coverageMarketplace coverageEmployer coverageMarketplace coveragePays nothing$1 to less than $125$125 or moreDon't know or refusedPercent of adults ages 19 64 with single policies60%57%755025100060%66%39%60%Paid less than $125 Americans Experiences with ACA Coverage.
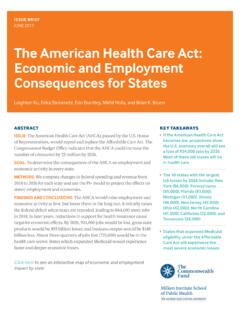
7 affordability 3employer coverage in this income range, 60 percent paid less than $125 per month, including 16 per-cent who paid the ACA, adults with incomes between 250 percent and 400 percent of poverty ($29,425 to $47,080 for a single person) receive smaller tax credits for marketplace coverage, while those with incomes above 400 percent of poverty receive no tax credit and pay the full premium. In contrast, most people in employer plans, regardless of income level, receive premium contributions from their employers. Thus, among adults at 250 percent of poverty or higher, 58 percent of those with marketplace coverage spent $125 a month or more on premiums compared with only 34 per-cent of those in employer of Adults in Marketplace Plans Say Their Premiums Are AffordableWhen we asked people their views on affordability , we limited the survey sample to respondents who paid all or part of their premium and knew the amount they (49%) of adults with marketplace coverage found it somewhat or very easy to afford their premium (Exhibit 2).
8 This rate is statistically unchanged from April June 2014, after the ACA s first open enrollment season (data not shown).5 People with marketplace coverage those with low as well as higher incomes found it more difficult to afford their premiums than did people with employer coverage. Compared to other survey respondents, employer plan enrollees with higher incomes reported the easiest time affording their of affordability diverge at higher income levels. This reflects the phase out of premium tax credits in marketplace plans at higher incomes and the fact that people in employer plans are much more likely to have higher incomes than are marketplace enrollees. Half (51%) of 19-to-64-year-old adults in employer plans had incomes of 400 percent of poverty or higher, compared with only 19 percent of those in marketplace plans (Table 1).
9 3035273232361940213017440255075100 MarketplaceEmployerMarketplaceEmployerMa rketplaceEmployer496275 Half of Adults in Marketplace Plans View Their Premiums as AffordableSomewhat easyVery easyAdults ages 19 64 who pay all or some of premium and are aware of their premium amount487949 Percent who found it somewhat or very easyIncomes below 250% FPLI ncomes 250% FPL or moreTotalExhibit 2 Source: M. Gunja, S. R. Collins, M. M. Doty, and S. Beutel, Americans Experiences with ACA Marketplace Coverage: affordability and Provider Network Satisfaction,The Commonwealth Fund, July : FPL refers to federal poverty level. 250% of FPL is $29,425 for an individual or $60,625 for a family of four.
10 Segments may not sum to subtotals because of rounding. Data: The Commonwealth Fund Affordable Care Act Tracking Survey, February April easy or difficult is it for you to afford the premium costs for your Health insurance? 4 The Commonwealth FundLower-Income Adults with Marketplace Coverage Less Likely to Have High DeductiblesThe ACA requires insurers that sell plans in the marketplaces to offer silver-level plans that come with cost-sharing reductions for adults earning between 100 percent and 250 percent of the federal poverty level. These reductions lower an individual s deductible amount, copayments, and coinsurance, sub-stantially so for enrollees with the lowest In 2016, 57 percent of marketplace enrollees are estimated to be covered by plans with these effect is clear: among marketplace enrollees living under 250 percent of poverty, 30 percent said they had deductibles of $1,000 or more (Exhibit 3).