Transcription of TRANSAMERICA FUNDS ANNUAL REPORT
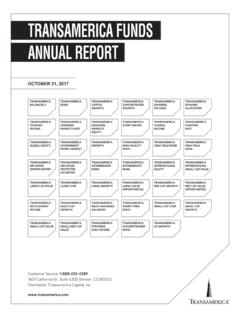
1 TRANSAMERICA FUNDS . ANNUAL REPORT . OCTOBER 31, 2017 . TRANSAMERICA TRANSAMERICA . ASSET ALLOCATION ASSET ALLOCATION . CONSERVATIVE GROWTH. PORTFOLIO PORTFOLIO. ASSET ALLOCATION TRANSAMERICA . ASSET ALLOCATION . TRANSAMERICA . ASSET ALLOCATION . FUNDS MODERATE GROWTH. PORTFOLIO. MODERATE. PORTFOLIO. TRANSAMERICA TRANSAMERICA . ASSET ALLOCATION ASSET ALLOCATION. INTERMEDIATE LONG HORIZON. HORIZON. TRANSAMERICA TRANSAMERICA . ASSET ALLOCATION MULTI-MANAGER. SHORT HORIZON ALTERNATIVE. STRATEGIES. PORTFOLIO. Customer Service: 1-888-233-4339. 1801 California St., Suite 5200 Denver, CO 80202. Distributor: TRANSAMERICA Capital, Inc. Table of Contents Shareholder Letter 1. Manager Commentary and Schedule of Investments TRANSAMERICA Asset Allocation Conservative Portfolio 2. TRANSAMERICA Asset Allocation Growth Portfolio 7. TRANSAMERICA Asset Allocation Moderate Growth Portfolio 12. TRANSAMERICA Asset Allocation Moderate Portfolio 17. TRANSAMERICA Asset Allocation Intermediate Horizon 22.
2 TRANSAMERICA Asset Allocation Long Horizon 25. TRANSAMERICA Asset Allocation Short Horizon 28. TRANSAMERICA Multi-Manager Alternative Strategies Portfolio 31. Understanding Your FUNDS ' Expenses 35. Statements of Assets and Liabilities 37. Statements of Operations 39. Statements of Changes in Net Assets 42. Financial Highlights 50. Notes to Financial Statements 68. REPORT of Independent Registered Public Accounting Firm 83. Supplemental Information 84. Approval of Management and Sub-Advisory Agreements 85. Management of the Trust 90. Proxy Voting Policies and Procedures and Quarterly Portfolio Holdings 97. Notice of Privacy Policy 98. TRANSAMERICA FUNDS ANNUAL REPORT 2017 . Dear Shareholder, On behalf of TRANSAMERICA FUNDS , we would like to thank you for your continued support and confidence in our products as we look forward to continuing to serve you and your financial adviser in the future. We value the trust you have placed in us.
3 This ANNUAL REPORT is provided to you to show the investments of your fund (s). The Securities and Exchange Commission requires that ANNUAL and semi- ANNUAL reports be sent to all shareholders, and we believe it to be an important part of the investment process. This REPORT provides detailed information about your fund (s) for the 12-month period ending October 31, 2017 . We believe it is important to understand market conditions over the last year to provide a context for reading this REPORT . In early November of 2016, the surprise election victory of Donald Trump generated a strong reaction in both the equity and fixed income markets. As a result, the final two months of 2016 saw a move upward in stocks, driven by the prospect of less overall government regulation and the potential for legislation out of Washington pertaining to tax reform and enhanced levels of fiscal spending. Longer term interest rates also rose materially during this time in response to anticipation of new economic policies perceived to be more growth oriented and inflationary.
4 Between election-day and calendar year end, the 10-year Treasury yield jumped from to After this initial spike in long term yields, market interest rates fluctuated with the 10-year Treasury yield ranging from a high of in March 2017 to a low of in September 2017 . Much of this movement appeared to be in response to the lack of legislative progress regarding the new administration's economic agenda. On October 31, 2017 , the 10-year Treasury yield closed at Equity markets were a different story, as most major market indices, including the Dow Jones Industrial Average, the S&P 500 . and the NASDAQ moved higher during the year. The primary catalyst for the ascent in stocks was corporate earnings, as during the first half of 2017 S&P 500 companies posted their strongest levels of earnings growth in five years, as seen by aggregate double digit profit growth in both the first and second quarters. This helped to propel the equity markets even as the progress in Washington regarding new economic policy was significantly slower than anticipated.
5 These strong corporate profit results and lower default rates also helped to support credit markets as high yield bond spreads tightened to their lowest levels in three years. In regard to the broader economy, gross domestic product ( GDP ) growth exceeded 3% in the second quarter of 2017 for the first time in two years as steady job gains combined with growth in wages and consumer spending. The Federal Reserve ( Fed ) also moved more quickly toward normalizing short term interest rates, raising the Federal FUNDS Rate three times, effectively putting an end to the zero interest rate policy that had been in effect since 2008. In September 2017 , the Fed announced a formal schedule to finally begin reducing its balance sheet of more than $4 trillion in bonds, which will be implemented over several years. For the 12-month period ending October 31, 2017 , the S&P 500 returned while the MSCI EAFE Index, representing international developed market equities, gained During the same period, the Bloomberg Barclays US Aggregate Bond Index returned Please keep in mind that it is important to maintain a diversified portfolio as investment returns have historically been difficult to predict.
6 In addition to your active involvement in the investment process, we firmly believe that a financial adviser is a key resource to help you build a complete picture of your current and future financial needs. Financial advisers are familiar with the market's history, including long-term returns and volatility of various asset classes. With your adviser, you can develop an investment program that incorporates factors such as your goals, your investment timeline and your risk tolerance. Please contact your financial adviser if you have any questions about the contents of this REPORT , and thanks again for the confidence you have placed in us. Sincerely, Marijn Smit Tom Wald, CFA. President & Chief Executive Officer Chief Investment Officer TRANSAMERICA FUNDS TRANSAMERICA FUNDS The views expressed in this REPORT reflect those of the portfolio managers only and may not necessarily represent the views of the TRANSAMERICA FUNDS . These views are subject to change based upon market conditions.
7 These views should not be relied upon as investment advice and are not indicative of trading intent on behalf of the TRANSAMERICA FUNDS . TRANSAMERICA Asset Allocation Conservative Portfolio (unaudited). MARKET ENVIRONMENT. The 12-month period ended October 31, 2017 was characterized by rising equity markets around the world. The victory by Donald Trump in the November 2016 presidential election raised investor hopes for a regime of tax cuts, amped up infrastructure spending, and business deregulation. The equity markets responded positively as these expectations persisted throughout the year while at the same time corporate earnings grew strongly. Over the period, the S&P 500 returned small caps fared even better, with the Russell 2000 Index gaining Growth stocks significantly outpaced value stocks across all market-cap ranges. In the large-cap realm, for example, the Russell Top 200 Growth Index returned versus the Russell Top 200 Value Index's gain.
8 Foreign stocks were every bit as strong as stocks. The MSCI EAFE Index of developed foreign markets returned in dollar terms, while the MSCI Emerging Markets Index gained Gains in real estate investment trusts ( REITs ) were more muted globally. The FTSE EPRA/NAREIT Developed REITS Index was up only for the period. Bond returns were subdued as the Federal Reserve ( Fed ) gradually tightened its monetary policy. The Fed raised the Federal FUNDS Rate three times during the period (December 2016, March 2017 , and June 2017 ). Also, in September 2017 the Fed announced it would begin reducing its holdings of Treasuries and mortgage bonds by not replacing maturing bonds, effectively shrinking money supply. These moves were well-forecast, and the bond market seemed to take them in stride. Bonds initially sold off sharply after the November 2016 Trump victory (given the expectation for inflationary policies). But bonds clawed back some of those losses throughout 2017 even as the Fed tightened.
9 Overall, Treasury prices retreated only moderately for the period as a whole, pushing the yield on the 10-year Treasury from on November 1, 2016 to as of October 31, 2017 . The Bloomberg Barclays US Aggregate Bond Index still managed to post a positive total return. Foreign investment-grade bonds also sold off in November 2016 before recovering ground in 2017 's first half; the Citi WGBI Non-USD Index managed a return for the full 12-month period. Meanwhile, high-yield bonds gained strongly on the back of healthy corporate earnings, with the Bloomberg Barclays US Corporate High-Yield 2% Issuer Capped Index notching an return. Emerging markets debt also enjoyed meaningful gains; the JPMorgan EMBI Global Diversified Index returned in dollar terms. PERFORMANCE. For the year ended October 31, 2017 , TRANSAMERICA Asset Allocation Conservative Portfolio Class A returned , excluding any sales charges. By comparison, its primary and secondary benchmarks, the Bloomberg Barclays US Aggregate Bond Index and the Wilshire 5000 Total Market IndexSM, returned and , respectively.
10 STRATEGY REVIEW. The goal of the fund has always been to provide investors one-stop participation in the global financial markets, including asset classes beyond those reflected in the primary and secondary benchmarks. The fund provides a mix of about 35% equity and 65% fixed-income securities under normal conditions. The equity side is intended to cover both domestic and international markets across a range of investment styles, including larger and smaller companies and value and growth stocks. The fixed-income portion normally includes investment-grade and credit-sensitive holdings, shorter- and longer-term bonds, and international bonds. The fund also normally incorporates emerging markets, and can own real estate securities and alternative strategies such as managed-futures, global-macro, event-driven strategies. During the reporting period, management's underweight to stocks and overweight to foreign developed markets prompted by lofty equity valuations was essentially a wash.