Transcription of Transformer sweep frequency response analysis (SFRA)
1 Energize - October 2007 - Page 28 TRANSMISSIONOne approach is to attempt automated analysis , and this paper presents an approach using crosscorrelation coefficients. This is a power signal processing tool that can simplify result interpretation in some cases and allow limits to be common failure mode for power transformers is consequent to mechanical deformation of the core or windings. Core damage is more likely as a result of transportation, while winding damage is more likely to be caused by short circuit type forces. Consequently, the requirements are for Transformer to be checked before and after a new delivery or re-location, and also after any major fault. The latter might be after faults on a cable connected to the low voltage winding, or on a measurement Transformer on the high voltage, or a tap changer or bushing failure.
2 These close-up faults may be so severe as to initiate protection and then the need is to assess the damage to the , there could be lesser damage in the form of deformation. This would reduce the capability of the winding to withstand any further faults the winding is bent but not broken. Knowledge of such damage is, therefore, part of a risk assessment process to be applied for critical IEC and IEEE standards, various diagnostic techniques are described, and these are to be used after routine or type testing. Two relevant to this discussion include turns ratio to detect if the winding has faulted, and leakage reactance to identify deformation. Over the years the measurement of leakage reactance (or short-circuit impedance) has proven valuable, particularly when used during with-stand evaluation in high power laboratories.
3 The impedance change allowed post fault can be defined as being less than a 2% change (see IEC60076-5). Provided the test is done correctly this provides a clear definition for acceptability. However, for in-service assessment it is considered by some that this method is insensitive. In the 1990s a group from the major utilities in northern Europe evaluated an alternative method involving the injection of a low voltage swept frequency sine wave into each winding in turn. They met as a working group of EuroDoble and at the end of the 1990s documented their experience in a Doble test guide and several papers at the annual Doble conferences [1], [2]. Today, groups within IEEE and Cigr are working to introduce the method into IEEE and IEC standards, and several companies n o w p r o d u c e i n s t r u m e n t s t o r e p l a c e the laborator y equipment used earlier.
4 Over these recent years the technique has gained acceptability with a much larger and rapidly expanding group (and including the recent-entr y suppliers of equipment). But this has created some problems for these new users and suppliers relating to the interpretation of the results. The experience is that this is a transitional phase and new users can acquire the skill within a short for that first phase there is an interest in having an analytical method, ideally producing a number, ideally as simple as that from leakage nature of SFRA resultsThe sweep frequency response analysis (SFRA) test involves injecting a signal at one end of a winding and measuring the response at the other end.
5 Responses with large variations in attenuation over the measured frequency range are obtained as a result of variations in the impedance of the complex L-C-R distributions of the windings. Since capacitances and inductances depend on detailed winding geometry, any movement results in changes in the frequencies at which resonances occur. It is the identification of changes in frequency response that is the essence of analysis and diagnosis of mechanical integrity. This is currently achieved with the expert eye - but the aim is to use some processing to yield numerical evaluation of differences in response also occur for reasons other than deformation. These include differences between individual phases, tap changer position and configurations of internal leads between the bushings and windings- as well as whether the oil was present or absent.
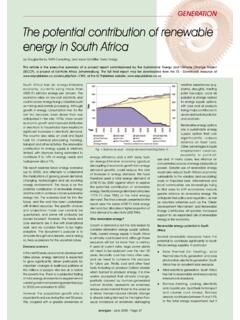
6 Unsuitable test equipment, lead connections and layout can produce repeatability issues. These issues present considerable challenges when contemplating any automation of the analysis . Fig. 1 shows a typical response for a high voltage star connected winding. The frequency range of interest is between 20 Hz and 2 MHz. Experience has shown that different sub-bands are dominated Transformer sweep frequency response analysis (SFRA) by G M Kennedy, A J McGrail and J A Lapworth, Doble Engineering, sweep frequency response analysis (SFRA) is one of the most powerful diagnostic tools for assessing mechanical damage to a Transformer winding. analysis of the results, which are in the form of frequency response traces can, however, be daunting to new 1: frequency analysis - October 2007 - Page 29by different internal components of the Transformer and are subsequently more sensitive to different types of failures, as summarized in Table 1.
7 Measurements above 2 MHz tend to be dominated by variations in grounding practices for test practice is to separate the response into frequency bands and relate the analysis to features in each band, as indicated in Table 1. The first resonance, here at around 600 Hz, is where the change from inductive to capacitive impedance occurs. The resonances at higher frequencies relate to the winding configuration. The above regions are a general rule of thumb dependent on Transformer design and test should be modified and adjusted by the user based on the observed waveform. For instance, the low frequency Region 1 could be changed to include all frequencies between the lowest and the first dominant pole, to completely encapsulate the core effect, or a sub band within Region 3 could be chosen that includes a series of dominant the analysis a response may be compared with one of the following: An earlier result for the same phase tested with the same tap changer position.
8 If no earlier result is available then another phase of the same Transformer , tested at the same occasion. The same phase, same tap changer position but on a unit believed to be of the same design group and made at the same preference for selection of options is in the order as correlation analysisSeveral attempts have been made over the years at creating automated or semi-automated SFRA analysis tools. Nearly all have been unsuccessful. The reasons for this lie not in the capability of the calculation or the application, but in three main areas: Large generic differences between responses of different winding types. This means that setting cross-correlation bands universally is difficult, if not impossible; hence the recommendation in this paper to make sure the user is able to set the band limits to match the Transformer and winding under test.
9 The fact that some differences between responses are inevitable and must be allowed due to measurement limitations or manufacturing tolerances. Unless appropriate allowances are made, dependent on Transformer designs and manufacturers, there is a risk that there will be false positives in the analysis . The subtle nature of some failures, which mean that the SFRA traces are almost acceptable , leading to a possible false negative in the analysis . The traditional view of the Doble team, some of whom have been reviewing data for almost 20 years, is that where unusual results are obtained, any decision must always be made by the expert to evaluate the existence of interferences from issues listed above. Where automated systems can help is as a short term crutch for the new user.
10 Most applications will be for fingerprinting sound transformers where there should be good overlay between other phases, sister units, some comfort factor will be a help to the new user since it will be able to identify the normal low level differences between traces being compared. The method can act as a filter so that the engineer can use their limited resource of time looking at the most important traces. The output should not be pass/fail but pass/investigate . The goals are to express results as pass where variations are within normal bounds for the configuration and a means to communicate results to end-customers who are not so familiar with 1: frequency sub-band frequency sub-band Component Failure sensitivity1 < 2 kHz Main core bulkwindinginductanceCore deformation, open circuits, shorted turns and residual magnetism2 2 kHz to 20 kHz Bulk componentshuntimpedancesBulk winding movement between windings and clamping structure3 20 kHz to 400 kHz Main windingsDeformation within the main or tap windings4 400 kHz to ~1 MHz Main windings,tap windingsand internal leadsMovement of the main and tap windings, ground impedances variationsTRANSMISSION energize - October 2007 - Page 30 Cross correlation coefficients (CCFs) are already used in a variety of industries, primarily telecom, where knowing the quality of signals is important.