Transcription of Transmission - Oregon
1 County COVID-19 CommunityTransmissionThe Centers for Disease Control and Prevention (CDC) have developed evidence-based metrics thatOregon public health officials use to determine and track COVID-19 community Transmission . What is the data source?Data presented in this document come from Oregon s case investigation database, the OregonPandemic Emergency Response Application (Opera). Opera is the tool by which Local Public HealthAuthorities (LPHAs) receive and process COVID-19 test results, including Electronic LaboratoryReports (ELRs) and Electronic Case Reports (ECRs), as well as manage information collected fromcase interviews and medical record reviews. What is the time period?
2 On Mondays, OHA pulls the number of COVID-19 cases, cases per 100,000 residents, and testpositivity by county for the previous four full weeks from Opera. Weeks run from Sunday to Saturdayfollowing the CDC s standard Morbidity and Mortality Weekly Report (MMWR) week. The case counts,case rates, and test positivity numbers from the previous full week are used to determine level ofcommunity spread. For case counts and case rates, cases are assigned to an MMWR week based onthe date when public health first identified them as a confirmed or presumptive COVID-19 case. Forpercent test positivity, lab results are assigned to a MMWR week based on the date the test result wasreported to public health.
3 How Does OHA Calculate Test Positivity?OHA receives test results from a variety of laboratories and health care providers. To calculate testpositivity, OHA pulls all test results received from Electronic Lab Reports (ELRs) and via Oregon sCOVID Reporting Portal (OCRP) that were reported to public health in the previous full MMWR weekby county. Next, the positive number of test results in each county are divided by the total number oftest results in each county to calculate the county s test positivity rate. Are Adults in Custody (AICs) Included in County Case Counts?The data presented in this document includes all COVID-19 cases reported in a jurisdiction, so mayinclude 11/10/2022 Document accessibility: For individuals with disabilities or individuals who speak alanguage other than English, OHA can provide information in alternate formats such astranslations, large print, or braille.
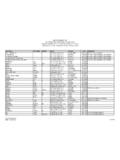
4 Contact the Health Information Center at1-971-673-2411, 711 TTY or 21/10/2022 Weekly Monitoring Periods From December 12 - January 8 This table is based on data pulled at 12:01 AM on 1/9/2022. For case counts and case rates, cases are assigned toa week based on their true case date, which is the date when public health first identified them as a confirmed orpresumptive COVID-19 case. For percent positivity in testing, lab results are assigned to a week based on the datetheir test result was reported to Public Health. All data are provisional and subject to change. Week of dataindicates the first day of the week for the data displayed. Weeks run Sunday to of DateCase CountCases per 100,000 Percent PositivityOregon,StatewideDecember 12, 2021 December 19, 2021 December 26, 2021 January 2, 2022 BakerDecember 12, 2021 December 19, 2021 December 26, 2021 January 2, 2022 BentonDecember 12, 2021 December 19, 2021 December 26, 2021 January 2, 2022 ClackamasDecember 12, 2021 December 19, 2021 December 26, 2021 January 2, 2022 ClatsopDecember 12, 2021 December 19, 2021 December 26, 2021 January 2, 2022 ColumbiaDecember 12, 2021 December 19, 2021 December 26, 2021 January 2, 2022 CoosDecember 12, 2021 December 19, 2021 December 26, 2021 January 2, 2022 CrookDecember 12, 2021 December 19.
5 2021 December 26, 2021 January 2, , ,38515,2336,9625, , , , ,8651, , , 31/10/2022 Weekly Monitoring Periods From December 12 - January 8 This table is based on data pulled at 12:01 AM on 1/9/2022. For case counts and case rates, cases are assigned toa week based on their true case date, which is the date when public health first identified them as a confirmed orpresumptive COVID-19 case. For percent positivity in testing, lab results are assigned to a week based on the datetheir test result was reported to Public Health. All data are provisional and subject to change. Week of dataindicates the first day of the week for the data displayed. Weeks run Sunday to of DateCase CountCases per 100,000 Percent PositivityCurryDecember 12, 2021 December 19, 2021 December 26, 2021 January 2, 2022 DeschutesDecember 12, 2021 December 19, 2021 December 26, 2021 January 2, 2022 DouglasDecember 12, 2021 December 19, 2021 December 26, 2021 January 2, 2022 GilliamDecember 12, 2021 December 19, 2021 December 26, 2021 January 2, 2022 GrantDecember 12, 2021 December 19, 2021 December 26, 2021 January 2, 2022 HarneyDecember 12, 2021 December 19, 2021 December 26, 2021 January 2, 2022 Hood RiverDecember 12, 2021 December 19, 2021 December 26, 2021 January 2, 2022 JacksonDecember 12, 2021 December 19, 2021 December 26.
6 2021 January 2, , ,5951, ,007867402321 Page 41/10/2022 Weekly Monitoring Periods From December 12 - January 8 This table is based on data pulled at 12:01 AM on 1/9/2022. For case counts and case rates, cases are assigned toa week based on their true case date, which is the date when public health first identified them as a confirmed orpresumptive COVID-19 case. For percent positivity in testing, lab results are assigned to a week based on the datetheir test result was reported to Public Health. All data are provisional and subject to change. Week of dataindicates the first day of the week for the data displayed. Weeks run Sunday to of DateCase CountCases per 100,000 Percent PositivityJeffersonDecember 12, 2021 December 19, 2021 December 26, 2021 January 2, 2022 JosephineDecember 12, 2021 December 19, 2021 December 26, 2021 January 2, 2022 KlamathDecember 12, 2021 December 19, 2021 December 26, 2021 January 2, 2022 LakeDecember 12, 2021 December 19, 2021 December 26, 2021 January 2, 2022 LaneDecember 12, 2021 December 19, 2021 December 26, 2021 January 2, 2022 LincolnDecember 12, 2021 December 19, 2021 December 26, 2021 January 2, 2022 LinnDecember 12, 2021 December 19, 2021 December 26, 2021 January 2, 2022 MalheurDecember 12, 2021 December 19, 2021 December 26.
7 2021 January 2, , ,4771, , 51/10/2022 Weekly Monitoring Periods From December 12 - January 8 This table is based on data pulled at 12:01 AM on 1/9/2022. For case counts and case rates, cases are assigned toa week based on their true case date, which is the date when public health first identified them as a confirmed orpresumptive COVID-19 case. For percent positivity in testing, lab results are assigned to a week based on the datetheir test result was reported to Public Health. All data are provisional and subject to change. Week of dataindicates the first day of the week for the data displayed. Weeks run Sunday to of DateCase CountCases per 100,000 Percent PositivityMarionDecember 12, 2021 December 19, 2021 December 26, 2021 January 2, 2022 MorrowDecember 12, 2021 December 19, 2021 December 26, 2021 January 2, 2022 MultnomahDecember 12, 2021 December 19, 2021 December 26, 2021 January 2, 2022 PolkDecember 12, 2021 December 19, 2021 December 26, 2021 January 2, 2022 ShermanDecember 12, 2021 December 19, 2021 December 26, 2021 January 2, 2022 TillamookDecember 12, 2021 December 19, 2021 December 26, 2021 January 2, 2022 UmatillaDecember 12, 2021 December 19, 2021 December 26, 2021 January 2, 2022 UnionDecember 12, 2021 December 19, 2021 December 26.
8 2021 January 2, , , , , ,7843,5241, , , , 61/10/2022 Weekly Monitoring Periods From December 12 - January 8 This table is based on data pulled at 12:01 AM on 1/9/2022. For case counts and case rates, cases are assigned toa week based on their true case date, which is the date when public health first identified them as a confirmed orpresumptive COVID-19 case. For percent positivity in testing, lab results are assigned to a week based on the datetheir test result was reported to Public Health. All data are provisional and subject to change. Week of dataindicates the first day of the week for the data displayed. Weeks run Sunday to of DateCase CountCases per 100,000 Percent PositivityWallowaDecember 12, 2021 December 19, 2021 December 26, 2021 January 2, 2022 WascoDecember 12, 2021 December 19, 2021 December 26, 2021 January 2, 2022 WashingtonDecember 12, 2021 December 19, 2021 December 26, 2021 January 2, 2022 WheelerDecember 12, 2021 December 19, 2021 December 26, 2021 January 2, 2022 YamhillDecember 12, 2021 December 19, 2021 December 26, 2021 January 2, , ,0062.