Transcription of TRANSPORT OF OXYGEN AND CARBON DIOXIDE IN
1 TRANSPORT OF OXYGEN AND CARBON DIOXIDE IN BLOODCONTENTS INTRODUCTION OXYGEN CASCADE OXYGEN DELIVERY DURING EXERCISE OXYGEN DELIVERY DURING CRITICAL ILLNESS CARBON DIOXIDE TRANSPORT O2 TRANSPORTREQUIREMENTS FOR OXYGEN TRANSPORT SYSTEMM atch O2 supply with demandMOVEMENT OF O2 DOWN CONCENTRATION GRADIENTOXYGEN CASCADE OXYGEN moves down the concentration gradient from a relatively high levels in air to that in the cell The PO2reaches the lowest level (4-20 mmHg) in the mitochondria This decrease in PO2 from air to the mitochondrion is known as the OXYGEN CASCADEKEY STEPS IN OXYGEN CASCADE Uptake in the lungs Carrying capacity of blood Delivery to capillaries Delivery to interstitium Delivery to individual cells Cellular use of oxygenDETERMINANTS OF PaO2 Inspired O2 concentration & barometric pressure Alveolar ventilation V/Q distribution & matching O2 diffusion from alveoli to pul capillaries OXYGEN TransportCarried in bld in 2 forms:1.
2 By red blood cells Bound to Hb 97-98%2. Dissolved O2in plasma Obeys Henry s lawPO2 x = O2 conc in sol = Solubility Coefficient ( at 37C) Low capacity to carry O2 Bound to HgbDissolvedHemoglobin Fe porphyrin compound Normal adult = HbA = 2 2 Hb F= 2 2 The chains hb affinity to O2 Each gm of Hb can carry up to of O2, theoretically up to ml/gmMolecular weight of hemoglobin is 64,000 CHEMICAL BINDING OF HEMOGLOBIN & OXYGEN Hemoglobin combines reversiblywith O2 Association and dissociation of Hb & O2occurs within milliseconds Critically fast reaction important for O2exchange Very loose coordination bonds between Fe2+and O2, easily reversible OXYGEN carried in molecular state (O2)
3 Not ionic O2- OXYGEN Saturation & Capacity Up to four OXYGEN molecules can bind to one hemoglobin (Hb) Ratio of OXYGEN bound to Hb compared to total amount that can be bound is OXYGEN Saturation Maximal amount of O2bound to Hb is defined as the OXYGEN CapacityO2 Content in blood (CaO2) 97-98% Carried in Combination With Hb 2-3% Dissolved in PlasmaO2 CONTENT -The sum of O2carried on Hb and dissolved in plasmaCaO2(ml/dL) = ( ) + ( ) O2 content in 100 ml blood (in normal adult with Hb 15 gm/dl) ~ 20 ml/dl( ml as OxyHb + ml in plasma)5027If the PAO2 is ed significantly (by breathing 100% OXYGEN ) then a small amount of extra OXYGEN will dissolve in the plasma (at a rate of ml O2/100ml of blood /mmHg PO2) but there will normally be no significant increase in the amount carried by haemoglobinVenous O2 content (CvO2) CvO2 =(SvO2xHb x ) + (PvO2x ) (normally-15ml/dl) mixed venous saturation (SvO2 ) measured in the pul A represents the pooled venous saturation from all organs.
4 SvO2 influenced by changes in both DO2 and VO2 Normally, the SvO2 is about 75%, however, clinically an SvO2 of about 65% is acceptable16 Arterial-Venous Difference The arterial-venous OXYGEN content difference is the difference between the CaO2 and the CvO2. The normal C(a-v)O2: 5 vol%.Factors that increase the C(a-v)O2: decreased cardiac output increased O2consumption exercise seizures shivering increased tempFactors that decrease the C(a-v)O2: increased cardiac output skeletal relaxation (drugs) peripheral shunting poisons decreased tempO2 DELIVERYDO2 (ml/min) = Q x CaO2 x 10DO2 = Q x Hb x SaO2 x x 10(multiplier of 10 is used to convert CaO2 from ml/dl to ml/L)N- 900-1,100 ml/min Decreased OXYGEN delivery occurs when there is.
5 Ed cardiac output ed hemoglobin concentration ed blood oxygenation18O2 CONSUMPTION The amount of OXYGEN extracted by the peripheral tissues during the period of one minute is called OXYGEN consumption or VO2. (N- 200-300ml/min)VO2= Q x (CaO2 - CvO2) x 10= Q x x Hb x (SaO2-SvO2) x 10 O2 consumption is commonly indexed by the patients body surface area (BSA) and calculated by: VO2/ BSA Normal VO2index is between 110 160ml/min/m219 OXYGEN EXTRACTION RATIO The OXYGEN extraction ratio (O2ER) is the amount of OXYGEN extracted by the peripheral tissues divided by the amount of O2 delivered to the peripheral cells.
6 Index of efficiency of O2 TRANSPORT aka: OXYGEN coefficient ratio & OXYGEN utilization ratio O2ER = VO2 / DO2 When SaO2 ~1 :O2ER ~ SaO2-SvO2 Normally ~ 25% but to 70-80% during maximal exercise in well trained athletesFactors that affect O2ER Increased with: Decreased CO Increased VO2 Exercise Seizures Shivering Hyperthermia Anemia Low PaO2 Decreased with: Increased Cardiac Output Skeletal Muscle Relaxation Peripheral Shunting Certain Poisons Hypothermia Increased Hemoglobin Increased PaO2. In general, DO2 >> VO2 When OXYGEN consumption is high (exercise) the ed O2 requirement is usually provided by an ed CO Alternatively, if OXYGEN delivery falls relative to OXYGEN consumption the tissues extract more OXYGEN from the hb (the saturation of mixed venous blood falls below 70%) (a-b )A reduction below point 'c' in figure cannot be compensated for by an increased OXYGEN extraction and results in anaerobic metabolism and lactic acidosis.
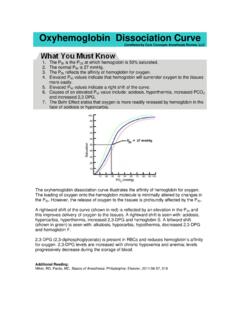
7 CRITICAL DO2O2 DIFFUSION FROM INTERSTITIUM TO CELLS Intracellular PO2 < Interstitial fluid PO2 O2 constantly utilized by the cells Cellular metabolic rate determines overall O2 consumptionN PcO2 ~ 5-40 mm Hg (average 23 mmHg)N intracellular req for optimal maintenance of metabolic pathways ~ 3 mm HgPasteur point critical mitochondrial PO2below which aerobic metabolism cannot occur kPa = Dissociation CurveThe relationship between the partial pressure of OXYGEN and the saturation of DISSOCIATION CURVE Sigmoid Shaped The amount of OXYGEN that is saturated on the hemoglobin (SO2) is dependent on the amount dissolved (PO2).
8 Amount of O2carried by Hb rises rapidly upto PO2of 60mmHg but above that curve becomes flatter When Hb takes up small amount of O2 relaxed state favours additional uptake Combination Of 1stHeme with O2increases affinity of 2ndHeme and so onSignificance of the S-shape curve100%% saturation of haemoglobinpartial pressure of O2(mmHg)Plateau: haemoglobin highly saturated with O2 favour the loading of O2in lungSteep slope: small drop of O2partial pressure leads to a rapid decrease in % saturation of haemoglobin favour the release of O2in tissue cellsSteep Portion of Curve Dissociation Portion of curve.
9 Between 10 and 60 mm Hg. Small increases in PO2yield large increases in SO2. At the tissue capillary, blood comes in contact with reduced tissue PO2and OXYGEN diffuses from the capillary to the tissue. Flat Portion of Curve Association Portion of curve. Greater than 60 mm Hg. Large increases in PO2yield small increases in SO2. At the pulmonary capillary, blood comes in contact with increased alveolar PO2and OXYGEN diffuses from the alveolus to the capillary. As the PO2rises, OXYGEN binds with the hemoglobin (increasing SO2). Very little rise in OXYGEN saturation above 100 mm Hg of of Thumb of the Oxyhemoglobin CurvePO2SO2275040756090250100PO2SO240705 0806090P50 The partial pressure of OXYGEN in the blood at which the haemoglobin is 50% saturated, is known as the P50.
10 The P50 is a conventional measure of haemoglobin affinity for OXYGEN Normal P50value is mm Hg As P50increases/decreases, we say the curve has shifted . P50less than 27: Shift to the left. P50greater than 27: Shift to the affecting Dissociation BLOOD TEMPERATURE increased blood temperature reduces haemoglobin affinity for O2 BLOOD Ph loweringof blood pH(making blood more acidic) caused by presence of H+ions from lactic acid or carbonic acid reduces affinity of Hb for O2 CARBON DIOXIDE CONCENTRATION the higher CO2concentrationin tissue the less the affinity of Hb for O22727 RIGHT SHIFTLEFT SHIFTD ecreasing P50 Bohr Effect By Christian Bohr in 1904 The effect of CO2on the OHDC is known as the Bohr Effect High PCO2levels and low pH decrease affinity of hemoglobin for OXYGEN (a right-ward shift).