Transcription of Trigonometric Fourier Series - University of North ...
1 3 Trigonometric Fourier Series Ordinary language is totally unsuited for expressing what physics really asserts,since the words of everyday life are not sufficiently abstract. Only mathematics andmathematical logic can say as little as the physicist means to say. Bertrand Russell(1872-1970) to Fourier SeriesWe will now turn to the studyof Trigonometric Series . You have seenthat functions have Series representations as expansions in powers ofx, orx a, in the form of Maclaurin and Taylor Series . Recall that the Taylorseries expansion is given byf(x) = n=0cn(x a)n,where the expansion coefficients are determined ascn=f(n)(a)n!.From the study of the heat equation and wave equation, we have foundthat there are infinite Series expansions over other functions, such as sinefunctions. We now turn to such expansions and in the next chapter we willfind out that expansions over special sets of functions are not uncommon inphysics.
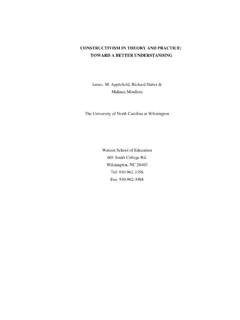
2 But, first we turn to Fourier Trigonometric will begin with the study of the Fourier Trigonometric Series expan-sionf(x) =a02+ n=1ancosn xL+bnsinn will find expressions useful for determining the Fourier coefficients{an,bn}given a functionf(x)defined on[ L,L]. We will also see if theresulting infinite Series reproducesf(x). However, we first begin with somebasic ideas involving simple sums of sinusoidal is a natural appearance of such sums over sinusoidal functions inmusic. A pure note can be represented asy(t) =Asin(2 f t),72 partial differential equationswhereAis the amplitude,fis the frequency in hertz (Hz), andtis time inseconds. The amplitude is related to the volume of the sound. The largerthe amplitude, the louder the sound. In show plots of twosuch tones withf=2 Hz in the top plot andf=5 Hz in the bottom 202ty(t)(a)y(t) =2 sin(4 f t)0123 202t(b)y(t) =sin(10 f t)y(t) : Plots ofy(t) =Asin(2 f t)on[0, 5]forf=2 Hz andf=5 these plots you should notice the difference due to the amplitudes andthe frequencies.
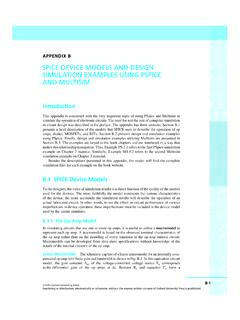
3 You can easily reproduce these plots and others in yourfavorite plotting an aside, you should be cautious when plotting functions, or samplingdata. The plots you get might not be what you expect, even for a simple sinefunction. In show four plots of the functiony(t) =2 sin(4 t).In the top left you see a proper rendering of this function. However, if youuse a different number of points to plot this function, the results may be sur-prising. In this example we show what happens if you useN=200, 100, 101points instead of the201points used in the first plot. Such disparities arenot only possible when plotting functions, but are also present when collect-ing data. Typically, when you sample a set of data, you only gather a finiteamount of information at a fixed rate. This could happen when getting dataon ocean wave heights, digitizing music and other audio to put on yourcomputer, or any other process when you attempt to analyze a : Problems can occur we plot the func-tiony(t) =2 sin 4 tusingN=201, 200, 100, 101 4 2024y(t)=2 sin(4 t) for N=201 pointsTimey(t)012345 4 2024y(t)=2 sin(4 t) for N=200 pointsTimey(t)012345 4 2024y(t)=2 sin(4 t) for N=100 pointsTimey(t)012345 4 2024y(t)=2 sin(4 t) for N=101 pointsTimey(t)Next, we consider what happens when we add several pure tones.
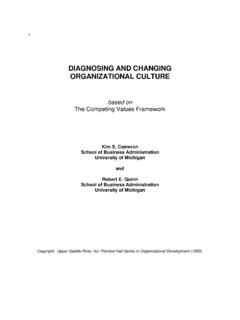
4 Afterall, most of the sounds that we hear are in fact a combination of pure toneswith different amplitudes and frequencies. In see what hap-pens when we add several sinusoids. Note that as one adds more and moretones with different characteristics, the resulting signal gets more compli-cated. However, we still have a function of time. In this chapter we will ask, Trigonometric Fourier Series 73 Given a functionf(t), can we find a set of sinusoidal functions whose sumconverges tof(t)? 0123 202ty(t)(a) Sum of signals with frequenciesf=2 Hz andf=5 202t(b) Sum of signals with frequenciesf=2 Hz,f=5 Hz, andf=8 (t) : Superposition of several at the superpositions in , we see that the sums yieldfunctions that appear to be periodic. This is not to be unexpected. We recallthat a periodic function is one in which the function values repeat over thedomain of the function.
5 The length of the smallest part of the domain whichrepeats is called the period. We can define this more precisely: A function issaid to be periodic with periodTiff(t+T) =f(t)for alltand the smallestsuch positive numberTis called the example, we consider the functions used in We began withy(t) =2 sin(4 t). Recall from your first studies of Trigonometric functionsthat one can determine the period by dividing the coefficient oftinto 2 toget the period. In this case we haveT=2 4 = at the top plot in can verify this result. (You cancount the full number of cycles in the graph and divide this into the totaltime to get a more accurate value of the period.)In general, ify(t) =Asin(2 f t), the period is found asT=2 2 f= course, this result makes sense, as the unit of frequency, the hertz, is alsodefined ass 1, or cycles per to , the functionsy(t) =2 sin(4 t),y(t) =sin(10 t),andy(t) = sin(16 t)have periods of , , and , superposition in a period that is the least commonmultiple of the periods of the signals added.
6 For both plots, this is ( )s=5(.2)s=8(.125) goal will be to start with a function and then determine the ampli-tudes of the simple sinusoids needed to sum to that function. We will seethat this might involve an infinite number of such terms. Thus, we will bestudying an infinite Series of sinusoidal , we will find that using just sine functions will not be enougheither. This is because we can add sinusoidal functions that do not neces-sarily peak at the same time. We will consider two signals that originateat different times. This is similar to when your music teacher would makesections of the class sing a song like Row, Row, Row your Boat starting atslightly different 202ty(t)(a) Plot of each 202t(b) Plot of the sum of the (t) : Plot of the functionsy(t) =2 sin(4 t)andy(t) =2 sin(4 t+7 /8)and their can easily add shifted sine functions.
7 In show thefunctionsy(t) =2 sin(4 t)andy(t) =2 sin(4 t+7 /8)and their that this shifted sine function can be written asy(t) =2 sin(4 (t+7/32)). Thus, this corresponds to a time shift of 7 , we should account for shifted sine functions in the general sum. Ofcourse, we would then need to determine the unknown time shift as wellas the amplitudes of the sinusoidal functions that make up the signal,f(t).74 partial differential equationsWhile this is one approach that some researchers use to analyze signals,there is a more common approach. This results from another reworking ofthe shifted should note that the form in thelower plot of like a sim-ple sinusoidal function for a reason. Lety1(t) =2 sin(4 t),y2(t) =2 sin(4 t+7 /8).Then,y1+y2=2 sin(4 t+7 /8) +2 sin(4 t)=2[sin(4 t+7 /8) +sin(4 t)]=4 cos7 16sin(4 t+7 16).
8 Consider the general shifted functiony(t) =Asin(2 f t+ ).( )Note that 2 f t+ is called the phase of the sine function and is calledthe phase shift. We can use the Trigonometric identity ( ) for the sine ofthe sum of two angles1to obtain1 Recall the identities ( )-( )sin(x+y) =sinxcosy+sinycosx,cos(x+y) =cosxcosy (t) =Asin(2 f t+ )=Asin( )cos(2 f t) +Acos( )sin(2 f t).( )Defininga=Asin( )andb=Acos( ), we can rewrite this asy(t) =acos(2 f t) +bsin(2 f t).Thus, we see that the signal in Equation ( ) is a sum of sine and cosinefunctions with the same frequency and different amplitudes. If we can findaandb, then we can easily determineAand :A= a2+b2,tan = are now in a position to state our - Fourier AnalysisGiven a signalf(t), we would like to determine its frequency content byfinding out what combinations of sines and cosines of varying frequenciesand amplitudes will sum to the given function.
9 This is called Trigonometric SeriesAs we have seen in the last section, we are interested in findingrepresentations of functions in terms of sines and cosines. Given a functionf(x)we seek a representation in the formf(x) a02+ n=1[ancosnx+bnsinnx].( )Notice that we have opted to drop the references to the time-frequency formof the phase. This will lead to a simpler discussion for now and one canalways make the transformationnx=2 fntwhen applying these ideas Series representation in Equation ( ) is called a Fourier trigonomet-ric Series . We will simply refer to this as a Fourier Series for now. The settrigonometric Fourier Series 75of constantsa0,an,bn,n=1, 2, .. are called the Fourier coefficients. Theconstant term is chosen in this form to make later computations simpler,though some other authors choose to write the constant term asa0.
10 Ourgoal is to find the Fourier Series representation givenf(x). Having foundthe Fourier Series representation, we will be interested in determining whenthe Fourier Series converges and to what function it (t)(a) Plot of functionf(t). (b) Periodic extension off(t).y(t) : Plot of the functionf(t)de-fined on[0, 2 ]and its periodic our discussion in the last section, we see that The Fourier Series isperiodic. The periods of cosnxand sinnxare2 n. Thus, the largest period,T=2 , comes from then=1 terms and the Fourier Series has period 2 .This means that the Series should be able to represent functions that areperiodic of period 2 .While this appears restrictive, we could also consider functions that aredefined over one period. In show a function defined on[0, 2 ].In the same figure, we show its periodic extension. These are just copies ofthe original function shifted by the period and glued together.