Transcription of Twin Cities Metro Regional Disparities by Race and Origin
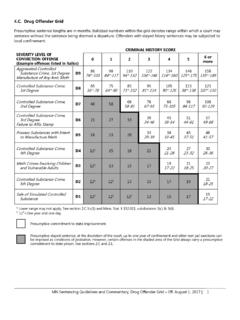
1 Twin Cities Metro Regional Disparities by Race and Origin The Twin Cities Metro Area consists Figure 1. Population by Race and Origin , 2018. of Anoka, Carver, Dakota, Hennepin, Ramsey, Scott, and Washington White Alone, Not Hispanic or Latino All Other Race Groups & Latino Origin counties. According to the Census Bureau's 2014-2018 American Community Survey (ACS) 5-year estimates, the Metro Area's total population is estimated at 3,039,708 people. Of this population, just under three-fourths ( ) reported being white alone, and not of Hispanic or Latino Origin . As such, over one- fourth ( ) of the region's population reported being a different race, such as Black or African Twin Cities Metro Area Minnesota American, American Indian or Alaska Source: Census Bureau, 2014-2018 American Community Survey Native, Asian or other Pacific Islander, Figure 2.
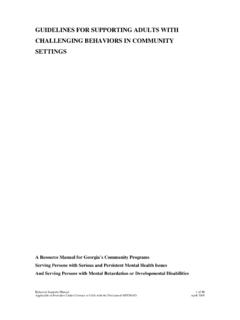
2 Population by Race and Origin by County, 2018. Some Other Race, Two or More Races, or of Hispanic or Latino Origin . White Alone, Not Hispanic or Latino All Other Race Groups & Latino Origin This distribution of race and Origin in the Metro Area was seven percentage points higher than Minnesota's total population, where of residents reported a race or Origin other than white alone (Figure 1). Zooming into the Metro Area, Hennepin County and Ramsey County are the region's most-populated counties, with a combined estimated population of 1,776,971 people. These two counties also happen to be Source: Census Bureau, 2014-2018 American Community Survey much more diverse than the Metro Area as a whole, with the share of persons not reporting as white in Hennepin and Ramsey counties at and , respectively.
3 While the Metro Area is more diverse than the state overall, Anoka, Carver, Scott, and Washington counties had smaller shares of racially and ethnically diverse populations than the state on their own (Figure 2). Population Growth The Twin Cities Metro Area is becoming more diverse with time. Since 2000, the region's total population has expanded by , equivalent to approximately 397,652 people. Those reporting as Black or African American grew by during that time, equivalent to approximately 132,208 people. In other words, since the turn of the century, the Black or African American population in the Metro Area grew at a rate times faster than total population growth. Other racial and ethnic groups experiencing rapid population growth in the region during that time include Hispanic or Latino persons (+ ), Asian or other Pacific Islanders (+ ), those reporting Some Other Race (+ ), and those reporting Two or More Races (+ ).
4 The white population in the Metro Area grew at a rate much slower (+ ) than total population growth, while the American Indian and Alaska Native population witnessed a decline in persons between 2000 and 2018 ( ) (Table 1). More recently, between 2010 and 2018, the Metro Area's population grew by 231,806 people (+ ). Those reporting as a race other than white, or with Hispanic or Latino origins, grew by during this time, equivalent to 177,776. people. In other words, the region's diverse population accounted for of total population growth during that time. Twin Cities Disparities by Race Report DEED labor Market Information Office | | 11/20. Table 1. Population Change in the Twin Cities Metro , 2000-2018. Twin Cities Metro Minnesota Change Change from 2000-2018.
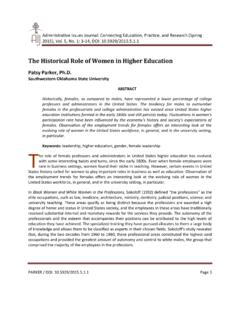
5 Number Percent Percent from Numeric | Percent 2000-2018. Total 3,039,708 +397,652 + + White 2,328,568 +90,451 + + Black or African American 288,828 +132,208 + + American Indian & Alaska Native 18,437 -1,980 + Asian & Other Pacific Islander 226,213 +103,974 + + Some Other Race 70,602 +25,541 + + Two or More Races 107,060 +47,458 + + Hispanic or Latino Origin 192,028 +96,126 + + Source: Census Bureau, 2014-2018 American Community Survey Employment Diversity According to employment data from Figure 3. Employment by Race, All Industries, Twin Cities Metro , the Census Bureau's Quarterly 2019. Workforce Indicators (QWI), people 100%. % of Total Employment by Race of different races make up about one- 80%. fifth ( ) of total employment in the Twin Cities Metro Area.
6 In the 60%. third quarter of 2019, that equaled 40%. approximately 353,571 jobs held by workers of other races, compared to 20%. 1,456,992 white workers. While still a 0%. minor portion, workers of other races 2005. 1999. 2000. 2001. 2002. 2003. 2004. 2006. 2007. 2008. 2009. 2010. 2011. 2012. 2013. 2014. 2015. 2016. 2017. 2018. 2019. held of total jobs in the region in 2000, meaning their employment White Alone Black or African American Alone presence essentially doubled from American Indian or Alaska Native Alone Asian or Other Pac. Islander 2000 to 2019 (Figure 3). Two or More Race Groups Source: Quarterly Workforce Indicators In sum, workers of other races have Figure 4. Employment by Other Races, All Industries, Twin Cities filled an additional 175,757 jobs in Metro , 2019.
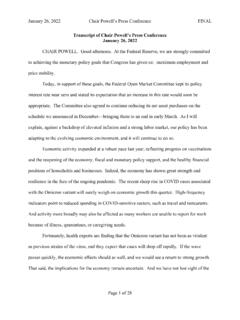
7 The Metro Area since 2000, Two or More Race Groups 400,000. accounting for of the 193,097 Asian or Other Pac. Islander Total Employment by Race new jobs added. With 162,416 jobs, 350,000. American Indian or Alaska Native Alone 39,382. Black or African Americans were the 300,000. largest race group in the Regional Black or African American Alone 250,000 29,565. 135,056. economy, after gaining 78,032 jobs 200,000 23,040. (+ ) since 2000. The next largest 20,219 105,537. 18,686 12,696. group was Asian or Other Pacific 150,000 73,955. 86,905. 64,040 10,370. Islanders, who held 135,056 jobs in 100,000 10,704 9,610 9,137. 2019 after gaining 71,016 jobs 162,416. 50,000 84,384 100,105 125,381. 92,289. (+ ) from 2000. Workers of Hispanic or Latino Origin filled 97,283 0.
8 2009. 1999. 2000. 2001. 2002. 2003. 2004. 2005. 2006. 2007. 2008. 2010. 2011. 2012. 2013. 2014. 2015. 2016. 2017. 2018. 2019. jobs in the region, up 49,506 jobs (+ ) since 2000. Workers Source: Quarterly Workforce Indicators reporting two or more race groups filled 39,382 jobs in the region, up by 20,696 jobs (+ ) since 2000. American Indian and Alaska Natives filled 12,696. jobs in the region, up by 1,992 jobs (+ ) since 2000. For reference, the number of white workers in the Metro Area increased by 17,340 jobs (+ ) from 2000 (Figure 4). Twin Cities Disparities by Race Report DEED labor Market Information Office | | 11/20. Several sectors in the Twin Cities Metro Area are diverse, but there are a couple of industries that rely more heavily on workers of other races.
9 The largest number of minority workers are employed in Health Care and Social Assistance, where nearly one-in-three jobs ( ) are held by workers of other races. That's equivalent to over 88,600 jobs. Over one-in-five jobs ( ) are held by workers of other races in Manufacturing. That's equivalent to over 40,100 jobs. Accommodation and Food Services, Retail Trade, and Administrative and Support Services also had diverse workforces (Figure 5). A significant number of jobs were held by those with Hispanic or Latino origins in Accommodation and Food Services (17,199 jobs), Health Care and Social Assistance (11,746 jobs), Administrative and Support Services (11,278. jobs), Manufacturing (10,492 jobs), and Retail Trade (9,265 jobs).
10 Figure 5. Industry Employment by Other Races, Twin Cities Metro , 2019. Health Care & Social Assistance 56,261 6,317 24,001. Manufacturing 11,375 25,034. Accomm. & Food Services 15,665 5,957 10,747. Retail Trade 13,124 9,368. Admin. & Support Services 15,519 7,958. Prof., Sci., & Technical Services 13,623. Educational Services 8,041. Finance & Insurance 8,519. Management of Companies 6,408. Public Administration Other Services Transp. & Warehousing 6,910. Wholesale Trade Construction Arts, Entertainment, & Recreation Information Real Estate & Rental & Leasing Utilities Agriculture 0 20,000 40,000 60,000 80,000 100,000. Black or African American Two or More Races Asian or Other Pac. Islander American Indian or Alaska Native Source: Quarterly Workforce Indicators Employment Characteristics Comparing the economic status of people of other races with the region's white residents reveals many Disparities including educational attainment, labor force participation , unemployment, and income and poverty levels.