Transcription of U.S. Business Response to the COVID-19 Pandemic - 2021
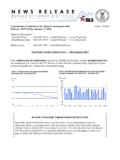
1 For release 10:00 (ET) Wednesday, February 9, 2022 USDL-22-0190 Technical information: (202) 691-6567 Media contact: (202) 691-5902 Business Response TO THE COVID-19 Pandemic 2021 As a result of the COVID-19 Pandemic , percent of private-sector establishments ( million, with percent of all private-sector employment) increased base wages, the Bureau of Labor Statistics reported today. Establishments in Accommodation and Food Services, Retail Trade, Health Care and Social Assistance, and Manufacturing increased base wages at a higher rate than average. Data in this release are from the 2021 Business Response Survey (BRS) to the Coronavirus Pandemic . BRS data were collected from private-sector establishments from July 27, 2021 through September 30, 2021. Topics covered include telework, workplace flexibilities, changes in pay, COVID-19 workplace requirements, establishment space size, relocation, supplementing workforce, automation, drug and alcohol testing, and COVID-19 loans or grants.
2 Detailed tables by industry, state, and employment size are available at 0510152025303540 Other services, except public administrationAccommodation and food servicesArts, entertainment, and recreationHealth care and social assistanceEducational servicesProfessional and Business servicesFinancial activitiesInformationTransportation and warehousingRetail tradeWholesale tradeManufacturingConstructionUtilitiesN atural resources and miningTotal , private sectorChart 1: Establishments that increased base wages (straight-time wages or salary) by industry (percent)-2 - Changes in Pay Hazard pay or an hourly bonus were temporarily offered by percent of establishments (471,000, with percent of all private-sector employment). One-time, special monetary bonuses for working during the Pandemic were paid by percent of establishments (809,000, with percent of all private-sector employment).
3 Changes in Telework As a result of the Pandemic , percent of establishments increased telework for some or all of their employees. Among establishments that increased telework during the Pandemic , percent expect to keep the increases permanent when the Pandemic is over. 010203040506070 Other services, except public administrationAccommodation and food servicesArts, entertainment, and recreationHealth care and social assistanceEducational servicesProfessional and Business servicesFinancial activitiesInformationTransportation and warehousingRetail tradeWholesale tradeManufacturingConstructionUtilitiesN atural resources and miningTotal , private sectorChart 2: Establishments that increased telework for some or all employees by industry (percent)-3 - COVID-19 Vaccinations at Establishments COVID-19 vaccinations were required for some or all employees before coming to work on-site at percent of establishments.
4 A larger share of establishments, 28 percent, offered some or all employees a financial incentive or paid time off, or permitted employees to remain on the clock to get a COVID-19 vaccination. 010203040506070 North DakotaSouth , private JerseyRhode IslandMassachusettsNew YorkDistrict of ColumbiaHawaiiCaliforniaPuerto RicoChart 3: Establishments that required some or all employees to get a COVID-19 vaccination before coming to work on-site by largest and smallest percent0102030405060 North DakotaSouth , private YorkVirginiaHawaiiNevadaMarylandWashingt onDistrict of ColumbiaCaliforniaPuerto RicoChart 4: Establishments that offered any employees a financial incentive, paid time off, or permitted employees to remain on the clock to get a COVID-19 vaccination by largest and smallest percent-4 - Flexible or Staggered Work Hours As a result of the Pandemic , percent of establishments ( million, with percent of all private-sector employment) started to offer flexible or staggered work hours to employees.
5 05101520253035404550 Size Class 9 (1000+)Size Class 8 (500-999)Size Class 7 (250-499)Size Class 6 (100-249)Size Class 5 (50-99)Size Class 4 (20-49)Size Class 3 (10-19)Size Class 2 (5-9)Size Class 1 (1-4)Total , private sectorChart 5: Establishments that started flexible or staggered work hours, by employment size (percent)Additional Industry, State, and Employment Size Data for the 2021 Business Response Survey to the Coronavirus Pandemic Tables with detailed, industry, state, and establishment size class data along with highlighted results, charts, and state maps can be found at Industry, state, and establishment size class data tables are available at Industry and establishment size class charts and state maps are available at -5 - More Information Data were collected from private-sector establishments only; government establishments were not surveyed.
6 As a result, the estimates of establishments and employment refer to private-sector establishments and employment. Total estimates include the 50 states , District of Columbia, and Puerto Rico. The full 2021 BRS Technical Note is available at An earlier survey, the 2020 BRS, asked seven questions about changes businesses made to their operations during the Pandemic through September 2020. These data are available at Definitions for terms used in this news release are available in the BLS Glossary a t -6 - Technical Note Methodology Data for the 2021 BRS were collected from July 27 through September 30, 2021. The BRS relied on the existing data collection instrument of the BLS QCEW program s Annual Refiling Survey (ARS). BRS survey responses were solicited via email and printed letters.
7 Responses were collected online using the platform that is consistently relied on by the ARS. This allows for a large, nationally representative sample to be surveyed with minimal financial costs to BLS. Definitions Establishments. An individual establishment is generally defined as a single physical location at which one, or predominantly one, type of economic activity is conducted. Most employers covered under the state UI laws operate only one place of Business . North American Industry Classification System (NAICS) codes. NAICS codes are the standard used by federal statistical agencies in classifying Business establishments for the purpose of collecting, analyzing, and publishing statistical data. The BRS is based on 2017 NAICS. Large/small. For these data, establishments with 2020 annual average employment greater than 499 are considered large.
8 Sample Design and Selection Procedures For the 2021 BRS, BLS selected a stratified sample of 322,560 establishments from a universe of just over million establishments. The universe source was the set of establishments from the 2020 fourth quarter BLS Business Register that were identified as in-scope for this survey. The BLS Business Register is a comprehensive quarterly Business name and address file of employers subject to state Unemployment Insurance (UI) laws. It is sourced from data gathered by the QCEW program. Each quarter, QCEW employment and wage information is collected and summarized at various levels of geography and industry. Geographic breakouts include county , metropolitan statistical area (MSA), state, and national.
9 Industry breakouts are based on the six-digit NAICS. The QCEW covers all fifty states , the District of Columbia, Puerto Rico, and the Virgin Islands. The primary sources of data for these 53 entities are the Quarterly Contributions Reports (QCRs) submitted to State Workforce Agencies (SWAs) by employers subject to state UI laws. The QCEW program also gathers separately sourced data for Federal Government employees covered by the Unemployment Compensation for Federal Employees (UCFE) program. There were a little over million establishments on the 2020 fourth quarter BLS Business Register that served as the source of the BRS s sampling universe. However, about million of these establishments were determined to be out-of-scope for the survey. Establishments that were excluded from the universe: Public Administration & Government (NAICS 92) Private Households (NAICS 814110) Postal Service (NAICS 491110) Services for the Elderly and Disabled Persons (NAICS 624120) with Establishment Size = 1 Unclassified Accounts (NAICS 999999) Virgin Islands (State FIPS 78) The 2021 BRS leveraged the technical and collection infrastructure of the ARS.
10 While the synchronization of the two surveys was efficient, it created a need to adapt the BRS sample in accordance with some of the constraints imposed on the ARS sample. Regarding ARS sampling constraints, establishments with one to three employees are never administered the ARS and, of the establishments that are eligible for the ARS, roughly one-third are administered the ARS in any given year. The determination as to which ARS eligible establishments are active for any year s ARS is based on a random mechanism. During BRS sample selection, active ARS eligible establishments and ARS ineligible establishments were selectable, whereas inactive ARS eligible establishments were disallowed from selection, in part as a means of managing respondent burden over time.
