Transcription of U.S. CORN PRICE VS. STOCKS/USE RATIO - Daily …
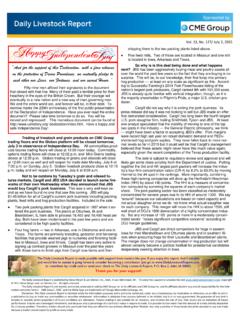
1 USDA s monthly Crop Produc-tion and World Agricultural Supply an d Demand Estimates (WASDE) reprorte, released Friday, contained for the most part numbers that were near their ex-pected levels. corn and soybean futures were up in Friday s trading but are giving back those gains plus some at the time of this writing on Monday morning. The yield, crop and ending stocks (carryout) dta for corn , beans and wheat appear at right. The trade was also watching for any significant changes that USDA might make to carryout stocks for the current crop year. Analysts expected a sharp reduciton in soybean stocks (from 330 million in June to 287 million this month) and got more than they expected as the Feds dropped estimated 2014/15 year-end soybean stocks to 255 million bushels. That num-ber was no doubt driven by lower June 30 stocks and was accounted for in the balance sheet by 15 million bushel increases in crushings and exports and a 44 million bushel increase in residual. We d feel a little better if the biggest adjustment was in something other than re-sidual but at this point USDA apparently doesn t know what might have happened to that amount of beans.
2 We had some bean crop balancing late in last year s season and may see that again in 15. Analysts also got a bite more of an adjustement than they expected on average for 2014/15 year-end corn stocks . USDA now estimates that there will be billion bushels in inventory at year-end, down form last month s billion and lower than the average of analysts forecasts, billion bushels. As for the 2015 crop, USDA played it close to the vest, choosing to hold yields constant for now at bushels/acre for corn and 46 bushels/acre for soybeans. We aren t surprised by that decision as rain makes grain is true so often that it is likely to early to discount the negative impact that too much water in some key areas might have on this year s crop. And that is especially under-standable given the excellent crop conditions that exist in much of the western Cornbelt. USDA will have results from the first of its objective yield surveys for the August report. Does that mean these yields will change?
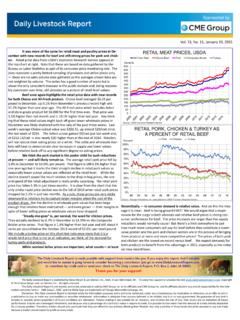
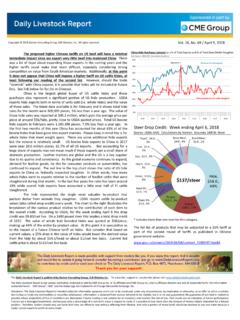
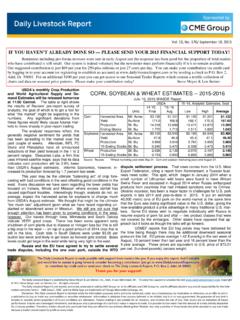
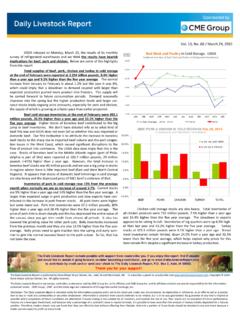
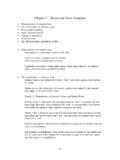
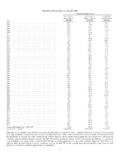
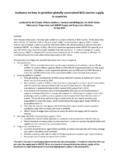
3 Maybe and maybe not. Those surveys may say strong yields in some areas will offset low yields elsewhere. The only changed in 2015-16 corn supply and utilization (table on page 2) were driven by the noted change in beginning stocks , lower acreage estimates from the June 30 Acreage report and a few tweaks to individual usage categories. The billion in fore-cast year-end stocks will represent of total usage, about 10% lower than last year but still significantly better than the four years prior to that. Note in the chart that the mid-point of USDA s forecast PRICE range ($ to $ ) would put the 2015-16 PRICE vs. S/U ration ob-servation below and eyeballed demand line that omits 2011 and 2012. It would be even farther below a line that included those two years. Several private PRICE forecasts of about $ per bushel look pretty accurate versus the S/U RATIO in this chart. USDA s soybean crop estimate increased due to higher planted and harvested acres estimates, again from the June 30 Acre-age report.
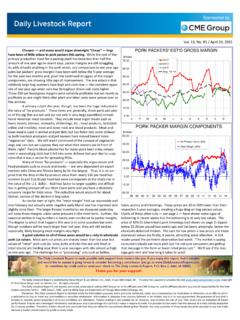
4 See the table on page 2. Those larger crop, though, was more than offset by the reduction in beginning stocks to leave total supply at billion bushes, about 80 million higher than this year but 40 million lower than the June estimate. USDA s only usage adjust-ment was a 10 million bushel increase in soybean crush, thus leaving year-end stocks 50 million lower than the June estimate. The S/U RATIO of is the highest since 2006 and the third highest since 1998. USDA remains more pessimistic than the futures market about soybean prices with the mid-point of its range being $ USDA raised its estimated meal PRICE range by $10 on each end. Vol. 13, No. 133/ July 13, 2015 Sponsored by The Daily Livestock Report is published by Steve Meyer & Len Steiner, Inc., Adel, IA and Merrimack, NH. To subscribe, support or unsubscribe visit Copyright 2015 Steve Meyer and Len Steiner, Inc. All rights reserved. The Daily Livestock Report is not owned, controlled, endorsed or sold by CME Group Inc.
5 Or its affiliates and CME Group Inc. and its affiliates disclaim any and all responsibility for the infor ma on contained herein. CME Group , CME and the Globe logo are trademarks of Chicago Mercan le Exchange, Inc. Disclaimer: The Daily Livestock Report is intended solely for informa on purposes and is not to be construed, under any circumstances, by implica on or otherwise, as an offer to sell or a solicita on to buy or trade any commodi es or securi es whatsoever. Informa on is obtained from sources believed to be reliable, but is in no way guaranteed. No guarantee of any kind is implied or possible where projec ons of future condi ons are a empted. Futures trading is not suitable for all investors, and involves the risk of loss. Past results are no indica on of future performance. Futures are a leveraged investment, and because only a percentage of a contract s value is require to trade, it is possible to lose more than the amount of money ini ally deposited for a futures posi on.
6 Therefore, traders should only use funds that they can afford to lose without affec ng their lifestyle. And only a por on of those funds should be devoted to any one trade because a trader cannot expect to profit on every trade. The Daily Livestock Report is made possible with support from readers like you. If you enjoy this report, find if valuable and would like to sustain it going forward, consider becoming a contributor. Just go to to contribute by credit card or send your check to The Daily Livestock Report, Box 2, Adel, IA 50003. Thank you for your support! Units14-'15 Final'15-'16 StocksBil. '15 Ending stocks Bil. '15 Ending stocks Bil. : Reuters *Wheat marketing year ends May 31. corn and soybean marketing years end August JULY 2015 corn , SOYBEAN & WHEAT ESTIMATES -- 2015-2016 Analysts' Estimates, JulyUSDAJulu 10, 2015 WASDE $/BushelYear-end stocks /Total corn PRICE VS. STOCKS/USE RATIOO mitted observations (S/U>30%):1981,1982, 1985, 1986 & 1987 Vol.
7 13, No. 133/ July 13, 2015 Sponsored by USDA June USDA July% Chng vs '13-14 Acres PlantedMil A HarvestedMil A StocksMil SupplyMil & ResidualMil for fuelMil FSIMil UsageMil Wtd. Avg. Farm PRICE $ - - - : USDA World Supply and Demand corn SUPPLY AND UTILIZATION - JULYU nits2013/142014/15 Estimate2015/2016 USDA June USDA July% Chng vs '13-14 Acres PlantedMil A HarvestedMil A StocksMil SupplyMil Mil UsageMil Wtd. Avg. Farm PRICE $ - - Oil - - Meal PRICE $ : USDA World Supply and Demand SOYBEAN SUPPLY & UTILIZATION - JULYU nits2013/142014/15 Estimate2015/16 Vol. 13, No. 133/ July 13, 2015 Sponsored by The Daily Livestock Report is published by Steve Meyer & Len Steiner, Inc., Adel, IA and Merrimack, NH. To subscribe, support or unsubscribe visit Copyright 2015 Steve Meyer and Len Steiner, Inc. All rights reserved. The Daily Livestock Report is not owned, controlled, endorsed or sold by CME Group Inc.
8 Or its affiliates and CME Group Inc. and its affiliates disclaim any and all responsibility for the infor ma on contained herein. CME Group , CME and the Globe logo are trademarks of Chicago Mercan le Exchange, Inc. Disclaimer: The Daily Livestock Report is intended solely for informa on purposes and is not to be construed, under any circumstances, by implica on or otherwise, as an offer to sell or a solicita on to buy or trade any commodi es or securi es whatsoever. Informa on is obtained from sources believed to be reliable, but is in no way guaranteed. No guarantee of any kind is implied or possible where projec ons of future condi ons are a empted. Futures trading is not suitable for all investors, and involves the risk of loss. Past results are no indica on of future performance. Futures are a leveraged investment, and because only a percentage of a contract s value is require to trade, it is possible to lose more than the amount of money ini ally deposited for a futures posi on.
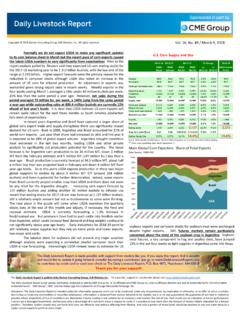
9 Therefore, traders should only use funds that they can afford to lose without affec ng their lifestyle. And only a por on of those funds should be devoted to any one trade because a trader cannot expect to profit on every trade. PRODUCTION AND PRICE SUMMARYWeek Ending7/11/15 ItemUnitsCurrent WeekLast WeekPct. Change Last YearPct. Change YTD Pct. ChangeTotal Meat & Poultry 46,105 SlaughterThou. ,815 Cow SlaughterThou. ,606 Live ,347 Dressed ProductionMillion ,058 Fed Steer$/cwt live Steer$/cwt Feeder Steer700-800 Cutout600-900 $/cwt live , 50% , 90% SlaughterThou. ,282 Sow SlaughterThou. ,431 Dressed ProductionMillion ,674 Minn. Base Carcass PriceWeighted Net Carcass PriceWeighted Cutout200 , 72% Chicken Slaughter*Million ,067 WeightLbs., ProductionMillion Lbs., ,747 ,624 PlacedMillion ,609 Composite Dock Leg Turkey Slaughter*Million ProductionMillion ,626 Region Hen8-16 , Omaha$ per , Minnesota$ per , Kansas City$ per , S.
10 Iowa$ per Meal, 48% Central Illinois$ per * Chicken & turkey slaughter, production and prices are 1 week earlier than the date at the top of this table. Cow & sow slaughter are for 2 weeks earlierSource: USDA Agricultural Marketing Service, various reports