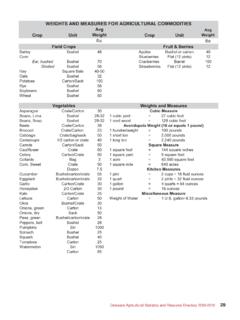
Transcription of U.S. Farmers by Gender, Age, Race, Ethnicity, and More
1 1 Farm Demographics Farmers by Gender, Age, Race, Ethnicity, and MoreUnited States Department of AgricultureNational Agricultural Statistics (800)727-9540 ACH12-3/May 2014 HighlightsIn 2012, Farmers were older and more diverse than in 2007, the last time the agriculture census was conducted. The total number of Farmers declined, with the percentage decline more for women than men. More minorities operat-ed farms in 2012, and the number of beginning Farmers Many Farmers ?In 2012, million Farmers operated million farms.
2 Like the previous agriculture census, the 2012 Census of Agriculture collected data on up to three operators per farm. Wheth-er counting only principal operators (the person primarily responsible for the day-to-day operation of the farm) or also second and third operators, the number of Farmers declined between 2007 and 2012 going down percent in the case of principal operators. (Table 1)Fourty-four percent of all farms report-ed having two operators, and 7 per-cent reported three operators involved in day-to-day decision making.
3 Princi-pal operators differ from second and third operators in a number of ways. They are on average older, more likely to be male, and more likely to consider farming their primary occupation. They work fewer days off the farm than do second and third operators, and in 2012, 78 percent were on their current farm ten or more years. (Table 2)Two thirds (67 percent) of second operators are women, of whom 90 percent are the spouse of the principal farm operator. Most farm operations report that they are organized as a family or individual operation.
4 Third operators are younger than principal operators and 45 percent were on their current farm less than ten years in 2012. Table 1 Number of Farmers , 2007 and 2012 Operators20072012% changePrincipal2,204,7922,109, * Second931,670928, *Third145,072142, *All3,281,5343,180, *Source: USDA NASS, 2012 Census of the Numbers * = statistically significant changeThe 2012 Census of Agriculture contains a measure of relative reliability (the coefficient of variation) for every data item published. This Highlights document does not include these numbers, but shows through an asterisk (*) every number that is a statistically significant change from the 2007 Census to the 2012 Census (defined as two or more standard errors).
5 To learn more about statistical significance and Census methodology, go to the frequently asked questions at million Farmers .. operated million farms covering 915 million acres that generated food, fuel, and fiber for Americans and people around the world. Who are they?Table 2 Gender, Primary Occupation, and Years on Farm, 2012(percent) FarmOperatorsGender Primary Occupation Years on Farm MaleFemaleFarmOther<1010+Principal861448 522278 Second336737633169 Third613943574555 All703044562674 Source: USDA NASS, 2012 Census of Farm DemographicsFewer Women FarmingOf the million principal operators in the United States, 288,264 were women (Table 3).
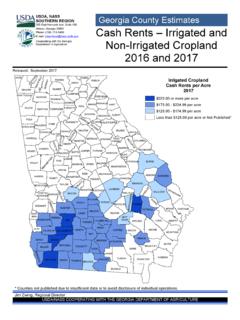
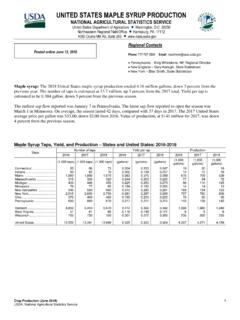
6 This was a 6 percent decrease since 2007 larger than the decrease in male principal operators. But for all female operators ( principal , second, and third), the decrease was only percent. Women were 14 percent of principal operators but 30 percent of all operators. Some areas of the country have higher concentrations of women Farmers than others. See particularly New England, Arizona, Oregon, and Washington (Fig. 1). In 16 states the number of female principal operators increased; in 34 states, they decreased.
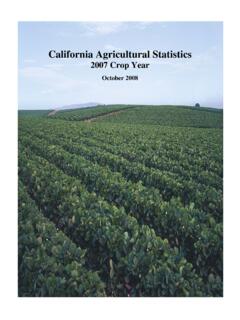
7 The number of women operating farms with annual sales of $10,000 or more increased in all categories, but 91 percent of farms with female principal operators had less than $50,000 in annual sales (Table 4). Table 3 Female and Male Farmers , 2007 and 201220072012% changeFemale OperatorsPrincipal 306,209 288, *All 985,192 969, *Male OperatorsPrincipal1,898,583 1,821, *All2,296,3422,210, *Source: USDA NASS, 2012 Census of 1 Farms with Female principal Operator, by County, 2012 Source: USDA NASS, 2012 Census of 4 Female principal Operators, by Sales Class, 2007 and 2012(number of operators and percent) Annual Sales2007 (%)Less than $10,000239,168218, *$10,000 to $49,99942,55344, *$50,000 to $99,9999,1119, *$100,000 +15,37715, *Total306,209288,264100*Source: USDA NASS, 2012 Census of Age Rising Consistent with a thirty-year trend, Farmers average age continued to increase (Fig.)
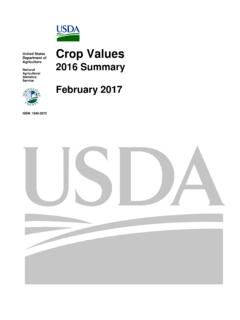
8 2). For principal operators, average age increased 2 percent between 2007 and 2012. Although second and third operators are younger, their average ages increased 4 and 3 percent respectively (Table 5). Among principal operators, 6 percent are under 35 years old, 61 percent are 35 to 64 years, and 33 percent are 65 and older. The older age groups all increased in number. (Fig. 3) Fig. 2 Average Age of principal Operator, 1982 - : USDA NASS, 2012 Census of 5 Average Age of Farm Operators, 2007 and 2012 Operator20072012% (years) * * *All *Source: USDA NASS, 2012 Census of < 1010 - 1415 - 1920 - 2425 + = Census of AgricultureFig.
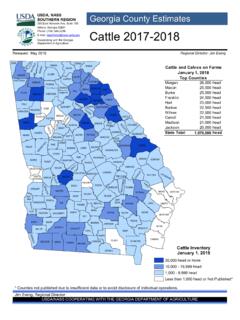
9 3 principal Operators by Age Group, 2007 and 2012number of principal operators75 years and over*257,705 Under 25 years10,71465 to 74 years*443,57155 to 64 years608,05245 to 54 years*466,03635 to 44 years*214,10625 to 34 years109,11911,878106,735268,818565,4015 96,306412,182243,472 Source: USDA NASS, 2012 Census of Diversity All categories of minority-operated farms increased between 2007 and 2012 (Fig. 4). Hispanic-operated farms were up 21 percent. Although more than half of all farms had sales of less than $10,000, minority-operated farms (except for Asian operated-farms) fell disproportionately into this group.
10 In 2012, more than a third of Asian principal Farmers operated farms with sales of $50,000 or more. (Table 6) In 2012, 70 percent of farms had Internet access, up from the last agriculture census. For all groups of minority farm-ers, access was higher in 2012 than 2007, with Black- and Asian-operated farms each having about a twenty percent-age point increase. (Fig. 5)Table 6 Share of Farms by Sales Class for Minority Operators, 2012(percent of group)AnnualSalesAll FarmsHispanicAmerican IndianBlackAsianLess than $10, $10,000 to $49, $50,000 to $99, $100,000 or more : USDA NASS, 2012 Census of 4 Minority principal Operators, 2007 and 2012number of principal operatorsHispanic*67,000 55,570 American Indian37,85134,706 Asian13,66911,214 Black33,37130,599 Source.