Transcription of U.S. Health Care Coverage and Spending - FAS
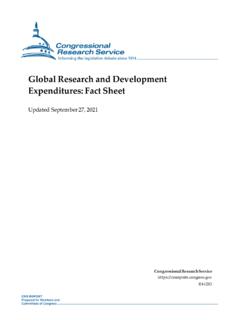
1 Updated January 26, 2021. Health Care Coverage and Spending In 2019, the United States had an estimated population of nonmedical net costs, which include, but are not limited to, 323 million individuals. Most of those individuals had taxes, net gains or losses to reserves, and profits. private Health insurance or received Health care services under a federal program (such as Medicare or Medicaid). Most of this Spending was for hospital care and physician About of the population was uninsured. and professional services (Figure 1). Private Health insurance Spending , as a percentage of all Health Individuals (including those who were uninsured), Health consumption expenditures, has increased by about 10. insurers, and federal and state governments spent percentage points since 1960 (Figure 2).
2 This growth is approximately $ trillion on various types of Health partially due to increases in enrollment and, when consumption expenditures (HCE) in 2019, which accounted considered alongside the implementation and expansions of for of the nation's gross domestic product. Medicare and Medicaid, corresponds with the drop in out- of-pocket Spending since 1960. Table 1. Health Care Coverage , 2019. Medicare Enrollment Medicare is a federal Health insurance program that pays for (millions/percentage covered Health care services for most people aged 65 and Source of population) older and for certain permanently disabled individuals Insured 293 ( ) under the age of 65. Private Health insurance Group 179 ( ) An estimated 58 million individuals ( of the population) were enrolled in Medicare in 2019.
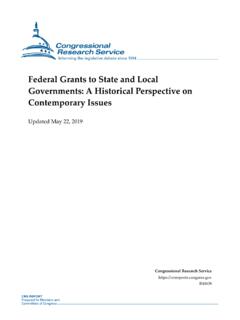
3 The Private Health insurance Non-group 42 ( ). program accounted for $799 billion ( of overall Medicare 58 ( ) HCE); this share is about 11 percentage points higher than Medicare's percentage of HCE in 1970 (Figure 2). In 2019, Medicaid/CHIP 64 ( ). most of the Spending was for hospital care and physician Military - TRICARE 9 ( ) and professional services (Figure 1). Military - VA Care 7 ( ) Figure 1. Health Consumption Expenditures by Type Uninsured 30 ( ) and Source, 2019. (in billions of dollars). Source: Census Bureau, Table HIC-4_ACS. Health Insurance Coverage Status and Type of Coverage by State-All Persons: 2008 to 2019, September 2020. Notes: Italicized = does not add to total. Individuals may have more than one type of Coverage at a time (for example, Medicare and Medicaid).
4 Therefore, estimates by type of Coverage are not mutually exclusive. CHIP = The State Children's Health Insurance Program. Medicaid/CHIP. Coverage estimate also includes all means-tested public Coverage , such as state and locally financed public Coverage . Private Health Insurance Private Health insurance is the predominant source of Health insurance Coverage in the United States. The private Health Source: Centers for Medicare and Medicaid Services, National Health insurance market includes both the group market (largely Expenditure Accounts National Health Expenditures by Type of Expenditure made up of employer-sponsored insurance) and the non- and Program, December 2020. group market (commonly referred to as the individual Notes: All of the terms used in this figure are defined in the source market, which includes plans directly purchased from an document, except long-term services and supports, which is defined in insurer both on and off Health insurance exchanges).
5 In 2019, these markets covered an estimated 179 million the text of this In Focus. DME = durable medical equipment. CHIP = The individuals ( of the population) and 42 million State Children's Health Insurance Program. individuals ( of the population), respectively. Medicaid/The State Children's Health In 2019, private Health insurance accounted for $1,195 Insurance Program (CHIP). billion ( of overall HCE). Private Health insurance Medicaid is a joint federal-state program that finances the expenditures (Figure 1) include amounts paid by insuring delivery of primary and acute medical services, as well as organizations to providers and all insuring organizations' long-term services and supports, to a diverse low-income Health Care Coverage and Spending population, including children, pregnant women, adults, Out-of-Pocket Spending individuals with disabilities, and people aged 65 and older.
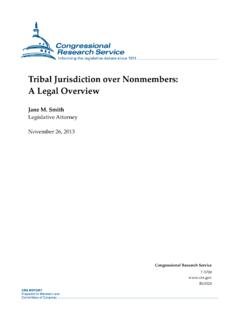
6 Out-of-pocket Spending (other than premiums) includes all amounts paid by the privately insured and other insured CHIP is a means-tested program that provides Health individuals for coinsurance, deductibles, and services not Coverage to targeted low-income children and pregnant covered by insurance. It also includes any amounts paid by women in families that have annual income above Medicaid the uninsured for Health care goods and services. Among all eligibility levels but have no Health insurance. individuals, out-of-pocket Spending totaled $407 billion ( of total HCE) in 2019. Figure 2. Health Consumption Expenditures (HCE) by Source as a Percentage of Total HCE, 1960-2019 The Uninsured Approximately 30 million individuals ( of the population) were uninsured in 2019.
7 The uninsured rate was relatively stable from 2008 to 2013 before dropping 6. percentage points by 2016 to (Figure 3). This drop in the uninsured rate corresponds with increases in non-group Coverage and Medicaid/CHIP Coverage , which are associated with the implementation of various provisions of the Affordable Care Act (ACA; 111-148, as amended), such as the exchanges and premium tax credits and the Source: Centers for Medicare and Medicaid Services, National Health Medicaid expansion. Since 2016, the uninsured rate has Expenditure Accounts National Health Expenditures by Type of Service and slowly increased. Source of Funds, CY1960-2019, December 2020. Note: CHIP = The State Children's Health Insurance Program. Figure 3. Health Insurance Coverage by Source as a Percentage of Total Population, 2008-2019.
8 An estimated 64 million individuals ( of the population) received Medicaid or CHIP in 2019, and the programs accounted for $633 billion ( of overall HCE). This Spending is about 10 percentage points higher than Medicaid/CHIP's percentage of total HCE in 1970. (Figure 2). Furthermore, Medicaid spends the highest percentage of expenditures on long-term services and supports, which includes (1) other Health , residential, and personal care; (2) nursing care facilities and continuing care retirement communities; and (3) home Health care (Figure 1). Long-term services and supports also includes some post-acute care ( , skilled care provided over a short term, Source: Census Bureau, Table HIC-4_ACS. Health Insurance Coverage typically after a hospitalization).
9 Status and Type of Coverage by State-All Persons: 2008 to 2019, September 2020. Military Notes: Individuals may have more than one type of Coverage at a time Health care services for military servicemembers, veterans, (for example, Medicare and Medicaid). Therefore, estimates by type of and their dependents are provided by the Department of Coverage are not mutually exclusive. CHIP = The State Children's Health Defense, through programs such as TRICARE, and the Insurance Program. Medicaid/CHIP Coverage estimate also includes all Department of Veterans Affairs. In 2019, an estimated 9 means-tested public Coverage , such as state and locally financed public million individuals ( of the population) had Coverage . TRICARE and 7 million ( of the population).
10 Individuals had VA Care. Together, these departments The cost of care for the uninsured population is accounted accounted for $125 billion ( ) of total HCE. for in multiple Spending categories (Figure 1 and Figure 2). Payments made by uninsured individuals for Health care Other Health Services services are included in the out-of-pocket total. Any Other Health care Spending covers services provided amounts received by providers that help to partially and/or through public and private programs not listed above, indirectly cover the cost of care for the uninsured are including worksite Health care programs, philanthropic accounted for in corresponding source totals ( , Medicare support, Indian Health Service activities, workers' and Medicaid disproportionate share hospital payments are compensation, general assistance, the Maternal and Child included in program totals).