Transcription of U.S. Research and Development Funding and Performance ...
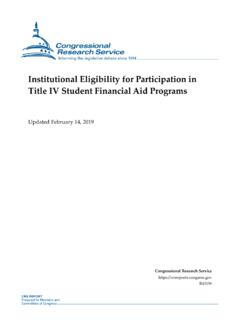
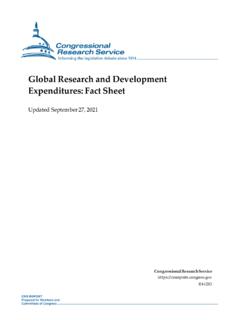
1 Research and Development Funding and Performance : Fact Sheet Updated October 4, 2021 Congressional Research Service R44307 Research and Development Funding and Performance : Fact Sheet Congressional Research Service 1 esearch and Development (R&D) in the United States is funded and performed by a number of sectors including the federal government, state governments, businesses, academia, and nonprofit organizations for a variety of purposes. This fact sheet begins by providing a profile of the R&D enterprise, including historical trends and current Funding by sector and by whether the R&D is basic Research , applied Research , or Development . The final section of this fact sheet includes data on R&D Performance by sector. Historical Trends in R&D Funding The United States became a global leader in R&D in the 20th century, Funding as much as 69% of annual global R&D in the period following World War Figure 1 shows the growth in total R&D expenditures from 1955 to 2019 in current R&D in 2019 was 105 times higher than it was in 1955 in current dollars, and more than 13 times higher in constant By sector, business-funded R&D grew the most during this period.
2 However, faster growth in total R&D spending of other nations reduced the share of global R&D to approximately in Figure 1. R&D Expenditures by Source of Funding , 1955-2019 Current dollars, in billions Source: CRS analysis of National Science Foundation, National Patterns of R&D Resources: 2018 19 Data Update, NSF 21-325, Table 6, April 9, 2021, Notes: 2019 data are preliminary and may be revised. Two sectors business and the federal government have together accounted for more than 90% of R&D Funding since 1955, though their combined share has fallen from a high of 98% in 1956 to 91% in 2016. federal R&D expenditures as a share of total R&D expenditures peaked in 1964 at , the same year that business R&D expenditures reached a nadir of Between 1964 and 2000, the federal government s share fell and business s share rose.
3 In 2000, business accounted for of R&D expenditures and the federal government This shift in the composition of R&D Funding resulted not from a reduction in federal 1 Office of T echnology P olicy, Depart ment of Commerce, The Global Context for Technology Policy, 1997. 2 Dat a for all years in t his report are for fiscal years unless ot herwise specified. 3 2019 is t he lat est year for which t ot al R&D dat a are available. 4 Organisat ion for Economic Co-operat ion and Development , at , Main Science and Technology Indicators, dat abase, ht t ps://st at Code=MST I_P UB. 2017 is t he lat est year for which complet e dat a is available. For more informat ion about global R&D, see CRS Report R44283, Global Research and Developm ent Expenditures: Fact Sheet, by John F.
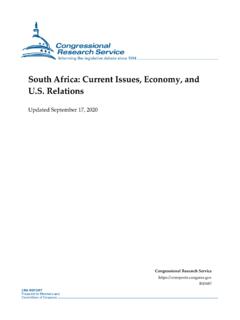
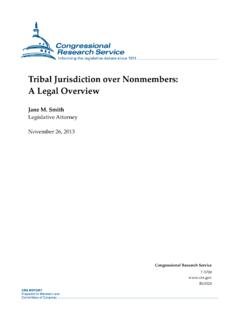
4 Sargent Jr. R Research and Development Funding and Performance : Fact Sheet Congressional Research Service 2 government R&D expenditures, but rather from faster growth in business R&D expenditures. From 2000 to 2010, business R&D s share declined from to , and has risen each year since, reaching an all-time high of in 2019; from 2010 to 2019, the federal share declined from to (See Figure 2.) Trends in Federally Funded R&D In current dollars, federal Funding for R&D grew from $ billion in 1955 to $ billion in 2019, a compound annual growth rate (CAGR) of In constant dollars, federal R&D grew by a CAGR during this period. However between 2011 and 2014, federal R&D Funding , as measured in current dollars, fell for three consecutive years for the first time since such data has been collected; the total decline in federal Funding for these years was $ billion ( ).
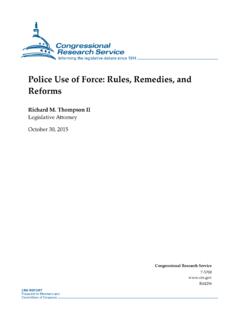
5 In constant dollars, federal R&D declined seven from 2009 to 2016 by a total ; a similar drop occurred from 1987 to 1994, when federal R&D fell by In FY2017, FY2018, and FY2019, federal R&D grew by , , and respectively, in constant 3 shows federal R&D Funding by budget function in constant dollars from 1955 to 2020. Figure 3. federal R&D Funding by Budget Function, 1955-2020 Current dollars, in billions Source: CRS analysis of data from National Science Foundation, federal R&D Funding , by Budget Function: Fiscal Years 2019 21, (NSF 21-315), Table 23, February 22, 2021, 5 CRS analysis of Nat ional Science Foundat ion, National Patterns of R&D Resources: 2018 19 Data Update, NSF 21-325, T able 6, April 9, 2021, ht t 6 Ibid. Figure 2.
6 federal and Business Shares of R&D Expenditures, 1955-2019 Source: CRS analysis of National Science Foundation, National Patterns of R&D Resources: 2018 19 Data Update, NSF 21-325, Table 6, April 9, 2021, Notes: 2019 data are preliminary and may be revised. Research and Development Funding and Performance : Fact Sheet Congressional Research Service 3 Notes: Data for 1955 1977 are obligations; data for 1978 2020 are budget authority. 2009 data includes supplemental R&D Funding provided by the American Recovery and Reinvestment Act of 2009 ( 111-5). All data are for fiscal years. Data for 2020 are preliminary and may be revised. p=preliminary. Trends in Business-Funded R&D Business Funding of R&D, measured in current dollars, has grown nearly every year since 1955. In current dollars, business-funded R&D grew from $ billion in 1955 to $ billion in 2019, a compound annual growth rate of In constant dollars, business-funded R&D grew by a CAGR during this period.
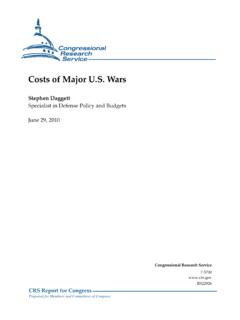
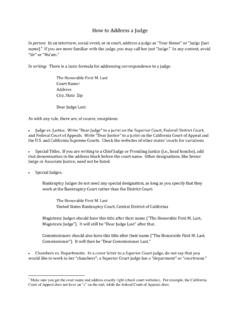
7 In recent years, business-funded R&D has grown at a slower pace. Between 2000 and 2019, business R&D grew by CAGR in current dollars, and by CAGR in constant Current Composition of R&D Funding R&D Funding can be categorized by the character of the work that it supports: basic Research , applied Research , and Development . (See text box for definitions.) Total estimated R&D expenditures in 2019 (the most recent year for which data are available) were $ billion. Of this amount, $ billion ( ) was for basic Research , $ billion ( ) was for applied Research , and $ billion ( ) was for Table 1 shows total R&D expenditures in 2018 by Funding sector and character of work. Notably, federal R&D Funding accounts for the largest share of basic Research ( ) while business accounts for the largest shares of applied Research ( ) and Development ( ).
8 Figure 4 shows this information graphically. Table 1. R&D Funding by Sector and character , 2019 Current dollars, in billions Sector Basic Research Applied Research Development Total Dollars Percent Dollars Percent Dollars Percent Dollars Percent federal Government Nonfederal Government Business Higher Education Other Nonprofit Organizations Total 7 Ibid. 8 Ibid. Element s do not add t o 100% due t o rounding. character of R&D: Definitions Basic Research . Experimental or theoretical work undertaken primarily to acquire new knowledge of the underlying foundations of phenomena and observable facts, without any particular application or use in view.
9 Applied Research . Original investigation undertaken to acquire new knowledge; directed primarily, however, toward a specific, practical aim or objective. Development . Systematic work, drawing on knowledge gained from Research and practical experience and producing additional knowledge, which is directed to producing new products or processes or to improving existing products or processes. Source: National Science Board, Science and Engineering Indicators 2018. Research and Development Funding and Performance : Fact Sheet Congressional Research Service 4 Source: CRS analysis of National Science Foundation, National Patterns of R&D Resources: 2018 19 Data Update, NSF 21-325, Tables 6-9, April 9, 2021. Note: Rows and columns may not add to totals due to rounding.
10 2019 data are preliminary and may be revised. Figure 4. R&D Funding by character and Sector, 2019 Source: CRS analysis of National Science Foundation, National Patterns of R&D Resources: 2018 19 Data Update, NSF 21-325, Tables 6-9, April 9, 2021. Notes 2019 data are preliminary and may be revised. Current Composition of R&D Performance R&D is often performed by sectors other than the one Funding the R&D. For example, the federal government performs some of the Research it funds, but also funds Research performed by business, universities and colleges, and other organizations. Table 2 provides data on Performance of R&D by sector and character of the work (basic Research , applied Research , and Development ). Table 2. R&D Performance by Sector and character , 2019 Current dollars, in billions Sector Basic Research Applied Research Development Total Dollars Percent Dollars Percent Dollars Percent Dollars Percent federal Government Nonfederal Government Business Higher Education Other Nonprofit Organizations Total Source: CRS analysis of National Science Foundation, National Patterns of R&D Resources: 2018 19 Data Update, NSF 21-325, Tables 2-5, April 9, 2021.