Transcription of U.S. SMALL BUSINESS ADMINISTRATION Frequently Asked …
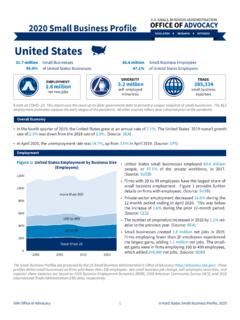
1 SMALL BUSINESS ADMINISTRATION . Frequently Asked Questions REGULATION RESEARCH OUTREACH. October 2020. 1. What is a SMALL BUSINESS ? The Office of Advocacy generally defines a SMALL BUSINESS as an Figure 1. Number of SMALL Businesses, 1997- independent BUSINESS having fewer than 500 employees. For 2017 (Millions; SUSB, NES). industry-level SMALL BUSINESS size standards used in 35. government programs and contracting, see 30. standards. 25. 20. 2. How many SMALL businesses are there in the 15 Nonemployer Firms There are million SMALL businesses in the 10. 81 percent, or million, have no employees (termed 5. nonemployers ) and 19 percent, or 6 million, have paid Employer Firms employees. 0. There are 20,139 large businesses. 1997 2002 2007 2012 2017. The number of SMALL employers has increased after a Figure 2: Net New Jobs, 2000-2019.
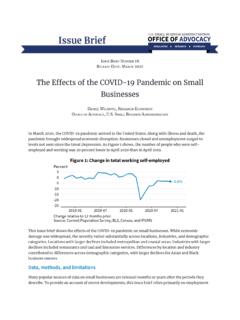
2 Decline during the Great Recession. The number of (Millions; BED, Office of Advocacy). nonemployers has gradually increased, from million 12. in 1997 to million in 2017 (Figure 1). Source: SUSB, NES 10. 8. 3. What is the role of SMALL businesses in the economy? SMALL businesses comprise: 6. of all firms 4. of firms with paid employees of exporters (285,334) 2. of known export value ($473 billion). of private sector employees (61 million) 0. of private sector payroll SMALL BUSINESS Large BUSINESS Source: SUSB, NES, ITA. Figure 3. Quarterly SMALL BUSINESS Job Gains, Job 4. What percent of net new jobs do SMALL businesses Losses, and Net Job Change 1992-2019 (Millions;. create? quarterly; BED, Office of Advocacy). 6000. From 2000 to 2019, SMALL businesses created million net new jobs while large businesses created million (Figure 2).
3 SMALL businesses have accounted for of net new job 4000. creation since 2000. Figure 3 displays quarterly SMALL BUSINESS job gains, losses, and net new jobs since 2000. Jo 2000 Job Gains Net Job Change Source: BED (white line). _____. This report uses the most recent available data from government 0. sources. Statistics on the number of SMALL businesses are based on the 1992 1996 2000 2004 2008 2012 2016. Census Bureau's 2017 Statistics of Businesses (SUSB) released in 2020 and 2017 Nonemployer Statistics (NES) released in 2019. The -2000. Census Bureau's SMALL BUSINESS Pulse Survey (SBPS) captures impacts Job Losses J. of the COVID-19 pandemic on SMALL businesses. All other sources reflect data collected prior to the COVID-19 pandemic. -4000. -6000. Frequently Asked Questions About SMALL Businesses Revised, October 2020.
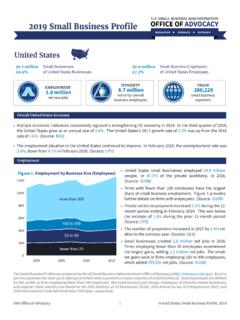
4 Figure 5: Industries Most Impacted By COVID-19. 5. How can SMALL businesses generate two-thirds of net (SBPS). new jobs, but their share of employment is less than 80%. 50%? 70%. As firms grow, they change employment size classes. As Percent Negatively impacted 60%. SMALL firms grow, their growth counts toward SMALL firm job gains. If they pass the 500-employee mark, their 50%. employment gains are classified as large firm employment. 40%. 30%. 6. What is the impact of COVID-19 on SMALL businesses? 20%. While the effects of the COVID-19 pandemic are still not fully known, the economic impacts have been particularly 10%. difficult on SMALL businesses so far. According to the 0%. Census Bureau SMALL BUSINESS Pulse Survey, of all Accomodation Arts Educational Health Care Manufacturing businesses surveyed through the second week of August and Food Entertainment Services Services and reported being financially impacted by the pandemic.
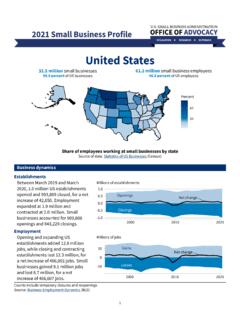
5 Recreation During the beginning of the pandemic, businesses with Source Note: Survey was for week of August 9th-15th between 20 to 49 employees had the largest employment decline of any size group. Also, the decline in BUSINESS activity among Black owners has been nearly three times 8. How many BUSINESS establishments open and close each the decline among other owners. year? In 2017, 1 million BUSINESS establishments opened, and 898,000. The pandemic has affected some industries more than establishments closed (Figure 4). About 13 percent of BUSINESS others. As Figure 5 shows, Accommodation and Food establishments are startups (Figure 6). Services along with Arts and Recreation are some of the Source: BED. hardest hit industries so far. Source: SBEP, SBPS, SBF 9.
6 What is the size of BUSINESS startups? In 2017, startup employment averaged employees per firm. 7. What is the new BUSINESS survival rate? Average employment at firms of all ages in 2017 was From 1994-2018, an average of of new employer employees per firm. establishments survived at least two years. During the same Source: ABS. period, the five-year survival rate was , the ten-year survival rate was , and the fifteen-year survival rate was Source: BED, BDS; Office of Advocacy calculations Figure 4: Establishment Births and Deaths Figure 6: Percent Establishment Births and 2008-2018 (Thousands; BED) Deaths 2008-2018 (BED). 1200 14%. 1000 12%. 800 10%. 600 8%. 400 6%. 200 4%. 2%. 0 Births Deaths 2008 2010 2012 2014 2016 2018 0%. Births Deaths 2008 2010 2012 2014 2016 2018.
7 Frequently Asked Questions About SMALL Businesses Revised, October 2020. Table 1: BUSINESS Owner Demographics, Employer and Nonemployer Firms (ABS, NES-D, SBO). Demographic Category 2017 Employer Firms Percent of Total 2016 Nonemployer Firms Total 5,744,643 24,813,000. Female 1,134,549 10,140,000. Minority 1,014,958 7,643,000. Asian 555,638 1,866,000. Veteran 351,237 2,079,000 (2012). Hispanic 322,076 3,338,000. Black or African American 124,004 2,806,000. Equally minority/nonminority 88,611 73,000. American Indian and 24,503 78,000. Alaska Native Native Hawaiian and 6,847 36,000. Other Pacific Islander 10. How many businesses do minorities own? 14. What are the self-employment trends by owner age? In 2017, of employer firms were minority owned, According to Census Bureau data, the share of self-employed totaling about 1 million businesses.
8 Of employer firms, Americans (including incorporated and unincorporated) age 30 or were Hispanic-owned, were Black (African under increased slightly from in 2013 to in 2018. American) owned, were Asian-owned, were During the same time frame, the share of self-employed age 65. owned by American Indians and Alaska Natives, and and over increased from to were owned by Native Hawaiians and other Pacific Source: CPS, March supplement, Islanders. (Table 1) #/. Source: ABS. 15. What percent of firms are family-owned? many businesses do women own? About one in three firms with employees (31%) were family- Women own million nonemployer firms (2016) or 41 owned in 2017. Family-owned firms averaged 14 employees per percent of all nonemployers, close to parity relative to firm, making them slightly bigger than non-family-owned firms men BUSINESS owners.
9 However, their million employer which employed 10 employees per firm. The industries with the firms (2017) represented only 20 percent of all employers. highest share of family-owned firms were Agricultural Services (Table 1) (46%) and Management of Companies and Enterprises (46%), Source: ABS while Health Care and Social Assistance (18%) was the lowest. Source: ABS. 12. How many businesses do veterans own? In 2017, veterans owned 351,237 employer businesses, or 16. What percent of firms are home-based? of employer firms. (Table 1) About a quarter of employer firms (24%), were home-based in Source: ABS 2016. By industry, almost half of construction firms (47%), and BUSINESS services (45%) were home-based. The share of home- 13. What percent of entrepreneurs are immigrants and based employer firms decreases as the firm age increases (for what industries are they most prevalent in?)
10 Example, 32% for firms 2 years or younger vs. 17% for firms 16. In 2017, about one in six (17%) of BUSINESS owners with and over). According to older data, when including businesses employees were immigrants. The industries with the without employees, about half of all businesses are home-based. greatest share of immigrant owners were Accommodation Source: ASE, SBO. and Food Services (37%) and Retail Trade (23%). 17. How are most SMALL businesses legally organized? Source: ABS. percent of nonemployers are sole proprietorships while only 14 percent of SMALL employer firms are sole proprietorships. More than half of SMALL employer firms are S-corporations (Table 2). Source: SUSB, NES. Frequently Asked Questions About SMALL Businesses Revised, October 2020. Table 2.