Transcription of Uganda Vision 2040 - World Bank
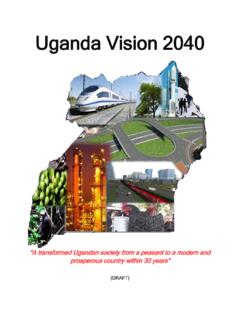
1 Uganda Vision 2040. A transformed Ugandan society from a peasant to a modern and prosperous country within 30 years . (DRAFT). Uganda Vision 2040. Accelerating Uganda 's Socioeconomic Transformation i FACT SHEET. GENERAL. Location East Africa and neighbouring; Kenya to the east, Tanzania to the south, Rwanda to the south-west, Democratic Republic of the Congo to the west, and South Sudan to the north. Area Total : 241 038sq km; Land: 197,100sq km; Water: 43 938sq km Population Year 2007 2010 2011. Total 30 263 000 31,848,169 32,939,800.
2 Female 51 per cent per cent per cent Male 49 per cent per cent per cent Capital Kampala. Time zone: GMT+3. Land use Arable land ( per cent); permanent crops ( per cent); other ( per cent). Independence 9 October 1962. Day ECONOMIC AND OTHER INDICATORS. GDP (Nominal) Billion US$ 17 billion (2010/11). GDP per capita Growth rate percent (2010/11). Real GDP Growth Rate percent (2010/11). Budget deficit percent (2010/11). Long-term debt (DOD, current US$) billion (2010/11). Workers' Remittances Received (US$) 79 million per month (2009).
3 Trade Exports US$ billion (2010/11). Imports (US$) billion (2010/11). Foreign Direct Investment US$ (2010/11). i ACRONYMS. ASCAs Accumulated Savings and Credit Associations ATMs Automated Teller Machines BTVET Business, Technical and Vocational Education and Training CAD/CAM Computer Aided Design and Manufacturing CBOs Community Bases Organizations CNDPF Comprehensive National Development Planning Framework EAC East African Community EACCM East African Community Common Market ERP Economic Recovery Program FAO Food Agricultural Organization FDI Foreign Direct Investments FIA Financial Institutions Act GDP Gross Domestic Product HDI Human Development Index HRD Human Resource Training ICT Information Communications Technology IT
4 Information Technology ITES Information Technology Enabled Services Km kilo meters kWh Kilo Watt hour LG Local Government MDIs Micro Deposit Taking Institutions MFA Micro Finance Act MICE Meetings Incentives Conferences and Events MoFPED Ministry of Finance Planning and Economic Development MRA Microfinance Regulatory Authority MW Mega Watt NDP National Development Plan NDPs National Development Plans ii NGOs Non-Governmental Organizations NPA National Planning Authority NRM National Resistance Movement OECD Organization for Economic Cooperation and Development PEAP Poverty Eradication Action Plan RD Research and Development ROSCAs Rotated savings and Credit Associations SACCO Savings Credit and Cooperative Company SAP Structural Adjustment Program SMEs Small and Medium Enterprises STIE Science Technology Innovation and Engineering UBOS Uganda Bureau of Statistics UNHS Uganda National Household Survey USD United States Dollars VSLAs Village Savings and Loan Associations iii TABLE OF CONTENTS.
5 FACT SHEET .. i ACRONYMS .. ii TABLE OF CONTENTS .. iv LIST OF TABLES .. vi LIST OF FIGURES .. vii CHAPTER 1: INTRODUCTION .. 1. Background .. 1. Context and Rationale .. 2. The Vision .. 2. CHAPTER 2: THE Vision ASPIRATIONS AND TARGETS .. 3. Aspirations .. 3. Vision Targets .. 3. The Vision Strategy .. 5. CHAPTER 3: GROWTH TRENDS AND MACROECONOMIC STRATEGIES .. 8. Growth Trends .. 8. Uganda 's Competitiveness .. 11. Growth Strategy .. 13. Key Sectors that will influence GDP Growth over the Vision 16. Macroeconomic Strategies.
6 17. Savings and Investments .. 17. Financial Services .. 18. Balance of Payments (BOP) .. 20. Public Finance .. 20. CHAPTER 4: HARNESSING OPPORTUNITIES BY STRENGTHENING THE FUNDAMENTALS.. 22. Opportunities .. 22. Abundant labour force .. 22. Minerals .. 24. Oil and 26. Industrialisation .. 29. iv Agriculture .. 31. Tourism .. 32. Knowledge and ICT sector .. 35. Geographical location and trade opportunities .. 38. Water resources .. 40. Fundamentals for Development .. 42. Human 43. Transport infrastructure and services.
7 44. Energy .. 46. Science, Technology, Engineering and Innovation .. 47. Urban Development .. 50. Land .. 54. Peace, Security and Defence .. 54. CHAPTER 5: SOCIAL TRANSFORMATION .. 56. Population:.. 56. Health and Nutrition .. 57. Education and Literacy .. 59. Care and Protection for the Vulnerable Population Groups .. 60. Housing Development .. 60. Environment and Natural Resources (ENR) .. 61. Gender Mainstreaming for Social Transformation .. 63. CHAPTER 6: GOVERNANCE, DEFENSE AND SECURITY .. 66. State of Governance.
8 66. Constitutional Democracy .. 67. Rule of 68. Electoral and Political processes .. 69. Transparency and accountability .. 69. Government Effectiveness and Regulatory Quality .. 70. Peace, Defence and Security .. 71. CHAPTER 7: IMPLEMENTATION, MONITORING AND EVALUATION STRATEGIES .. 73. v LIST OF TABLES. Table 2. 1: Baseline and Vision targets .. 4. Table 3. 1: Destination of Uganda 's Exports .. 10. Table 3. 2: The GDP Trend and Growth Rates under the Likely Scenario .. 15. vi LIST OF FIGURES. Figure 3. 1: Growth Patterns of some selected Middle Income Countries.
9 8. Figure : GDP Per-capita 9. Figure 3. 3: Growth Rates of Key Sectors .. 9. Figure 3. 4: The Trade Balance .. 10. Figure 3. 5: Uganda 's competitivenes with upper middle income countries .. 11. Figure 3. 6: Most problematic factors for doing business .. 12. Figure 3. 7: Labour force distribution by sectors .. 13. Figure 3. 8: Scenarios for Achieving the Upper Middle Income Status by 2040 .. 14. Figure 3. 9: Sector Shares of GDP (Actual and Forecasts) .. 17. Figure 3. 10: Savings Ratio Benchmarking .. 18. Figure 3. 11: Investment Ratio Benchmarking Source.
10 18. Figure 3. 12: Tax Revenue Benchmarking .. 20. Figure 4. 1: Map of Minerals .. 25. Figure 4. 2: Uganda Map of Oil and 28. Figure 4. 3: Uganda Map of Tourism developments .. 34. Figure 4. 4: Map of Economic Zones and Trade .. 39. Figure 4. 5: Map of Proposed Railway Network .. 45. Figure 4. 6: Framework for the National Innovation System .. 49. Figure 4. 7: Map of Proposed Strategic Cities & Road Network .. 52. Figure 4. 8: The planned road network for Greater Kampala Metropolitan Area .. 53. Figure 5. 1: National and Regional Poverty Estimates.