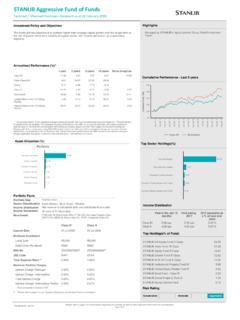
Transcription of UK Equity High Alpha Fund - : RIVER AND …
1 UK Equity High Alpha fund 31 July 2018. 5 Year Performance Cumulative performance of the fund and benchmark over the preceding five year period. Past performance is not a reliable indicator of future results. 1 Month % 3 Months % 1 Year % 3 Years % 5 Years %. B share class (Acc) FTSE All-Share index 80%. 60%. 40%. 20%. 0%. -20%. Jul 2013 Jul 2014 Jul 2015 Jul 2016 Jul 2017 Jul 2018. R&M UK Equity High Alpha fund B share class FTSE All-Share index Source: RIVER and Mercantile Asset Management LLP. Performance shown is of B' share class. Other share clases may be available. Performance is calculated using midday published prices and has been rebased to zero. Benchmark performance is calculated using close of business mid-market prices. Monthly Top 5 Performance Contributors & Detractors Market Capitalisation The best and worst contributors to the portfolio's performance Comparison of portfolio and benchmark weightings across a range relative to the benchmark.
2 Of indices based on company value. Old Mutual (+) fund Benchmark Active Impax Asset Management (+). SDL (+) FTSE 100 RhythmOne (+). Royal Dutch Shell 'A' (-) FTSE 250 AstraZeneca (-) FTSE Small Cap TP ICAP (+). Playtech (+) AIM MPAC Group (+). Other Main Market British American Tobacco (-). Cash Contribution + Overweight - Underweight Source: FactSet Source: RIVER and Mercantile Asset Management LLP. Sector Weights Top 10 Holdings Top 5 Overweights & Underweights Portfolio weightings within specific industrial The ten largest positions by weight held in The securities in which the portfolio weight sectors. the fund . differs most from that of the benchmark. Weight (%). Oil & Gas HSBC Holdings Standard Chartered Basic Materials Anglo American Industrials BP Old Mutual Consumer Goods Royal Dutch Shell 'B' Lloyds Bank Health Care Lloyds Bank Royal Bank of Scotland Consumer Services AstraZeneca Rio Tinto Telecoms Diageo Utilities GlaxoSmithKline Unilever Financials Standard Chartered British American Tobacco Technology BHP Billiton Royal Dutch Shell 'A'.
3 0 10 20 30 Barclays -6 -4 -2 0 2. Prudential Active Weight (%). Weight (%). Source: FactSet Source: FactSet Source: RIVER and Mercantile Asset Management LLP. RIVER and Mercantile Asset Management LLP. fund Manager: 30 Coleman Street, London EC2R 5AL. Hugh Sergeant Telephone: 0345 603 3618. Email: Portfolio Style Skyline Shows the Style TiltsTM of the fund against the benchmark as calculated by Style Research. UK Equity High Alpha fund 31 July 2018 fund Information fund Manager Hugh Sergeant Lauch date of fund 28 November 2006 Benchmark index FTSE All-Share IA Sector UK All Companies Total fund size Ex-distribution dates 1 April & 1 October Distribution dates 31 May & 30 November Number of Holdings 177 Source: Style Research Categories of Potential Codes B Shares (SEDOL/ISIN) B3D79W3/GB00B3D79W34 The weighting of the portfolio's holdings across the four categories of Potential, related to stages of a company's life cycle, as defined within the R&M investment philosophy.
4 Charges Initial Charge Up to Growth AMC (B). OCF (including AMC) (B). Asset Backed Dealing Information Trading frequency Daily Settlement T+4. Quality Min Investment (B). Recovery fund risk statistics fund Volatility Source: RIVER and Mercantile Asset Management LLP. Benchmark Volatility Beta Annual Performance History Active Money Discrete 12 month performance returns of the portfolio and the benchmark over a five year period. Past performance is not a reliable indicator of future results. Investment Objective 30%. The investment objective of the fund is to achieve 25%. capital growth by investing in a focused portfolio of 20%. investments which shall primarily consist of UK equities which offer the prospect of superior long term growth. 15%.
5 10%. 5%. 0%. Yr to Yr to Yr to Yr to Yr to 31/07/2014 31/07/2015 31/07/2016 31/07/2017 31/07/2018. R&M UK Equity High Alpha B Class FTSE All Share Source: RIVER and Mercantile Asset Management LLP. This document has been prepared and issued by RIVER and Mercantile Asset Management LLP ( R&M ), registered in England and Wales under Company No. OC317647, with its registered office at 30 Coleman Street, London EC2R 5AL, is authorised and regulated by the UK Financial Conduct Authority (FRN 453087). R&M is a subsidiary of RIVER and Mercantile Group Plc which is registered in England and Wales under Company No. 04035248, with its registered office at 30 Coleman Street, London EC2R 5AL. This document is intended for use by individuals who are familiar with investment terminology.
6 Please contact your financial adviser if you need an explanation of the terms used. For further details of the specific risks and the overall risk profile of this fund ; as well as the share classes within it, please refer to the Key Investor Information Documents and Prospectus which are available on our website The value of investments and any income generated may go down as well as up and is not guaranteed. An investor may not get back the amount originally invested. Past performance is not necessarily a guide to future performance. The Industry Classification Benchmark is a joint product of FTSE International Limited. FTSE International Limited ( FTSE ). FTSE 2017. FTSE is a trade mark of London Stock Exchange Group companies and is used by FTSE International Limited under licence.
7 All rights in the FTSE indices and/or FTSE ratings vest in FTSE and/or its licensors. Neither FTSE nor its licensors accept any liability for any errors or omissions in the FTSE indices and/or FTSE ratings and underlying data and no party may rely on any FTSE indices, ratings and/or underlying data contained in this communication. No further distribution of FTSE data is permitted without FTSE's express written consent. FTSE does not promote, sponsor or endorse the content of this communication.