Transcription of Undergraduate Admissions Statistics
1 Undergraduate Admissions Statistics2020 cyclePublished May 20212| University of CambridgeContentsUndergraduate Admissions Statistics are provided in the following categories:1 school /college type42 Region63 A Level profile94 Subject105 College216 Age257 Geodemographic classification268 Ethnicity289 Disability3110 The Admissions process32 Notes for information These Statistics refer to applications made from September 2019 onwards for admission to courses starting in October2020 or by deferred entry to courses starting in October 2021. Applicants holding a deferred offer from previousadmissions rounds are not included. Please note that the Statistics also exclude 285 applicants through UCAS who didnot submit a Supplementary Application Questionnaire (SAQ) in addition to a UCAS application, as required tocomplete their submission to the University. The term Home refers to applicants who have indicated in their UCAS application that they are permanently residentin the UK.
2 For more information about the UCAS application process, please Offer figures refer to applicants who received a conditional or unconditional offer of a place. Acceptance figures include only those applicants who received an unconditional firm offer of a place. It excludes thosemade conditional offers who were unsuccessful at confirmation. Success rate figures show the proportion of applicants accepted at confirmation. Percentages throughout have been rounded to one decimal place, so values given may not always add up to 100. Please note that the Statistics are not intended for use in the University s return to the Office for Students (OfS), as theyare calculated on a different basis. Equivalent tables for the previous application cycle may be found following tables and charts are produced annually and are intended to provide astatistical analysis of applicants to the Cambridge data has been prepared on behalf of the Admissions Forum of the CambridgeColleges by the Cambridge Admissions Office (email: Admissions Statistics 2020 cycleUniversity of Cambridge | 3 SummaryThe 2020 Admissions cycle was highly unusual, owing to the COVID-19 pandemic and the impact this had on theawarding of school leaving examination results.)
3 As a consequence, the University of Cambridge accepted over 450 moreundergraduates than note that last year s figures are shown in italicsin Applications, offers and acceptances by type of school /college and gender The total number of applications is 20,426 (19,359), an increase of The total number of offers is 4,710 (4,694), an increase of The total number of acceptances is 3,997 (3,528), an increase of The male:female ratio of accepted students is 48:52 (51:49). For applications from Home students attending UK schools/colleges the proportions of acceptances by school /college type are:Maintained ( )Independent ( )Table Home applications, offers and acceptances by A Level profile and gender Of those accepted, ( ) achieved the equivalent of A*AA or better counting onlytheir best three A Levels excluding General Studies and Critical Thinking. The number of unsuccessful applicants who went on to achieve the equivalent of A*AA or better counting only their best three A Levels excluding General Studies and Critical Thinking is 6,392 (4,002).
4 Table Home applicants, offers and acceptances by HE participation neighbourhood (POLAR4 quintile) The proportion of those accepted whose home postcode has a matching value in the POLAR4 directory andwho are in the lowest participation quintile is ( ). The proportion of those accepted whose home postcode has a matching value in the POLAR4 directory andwho are in the lowest two participation quintiles is ( ). In addition, ( ) of those accepted had a home postcode with no match or value in the POLAR4 Home applicants, offers and acceptances by OAC flag The proportion of those accepted whose home postcode has a matching value in the OAC directory and who are in a flagged subgroup is ( ). In addition, ( ) of those accepted had a home postcode with no match or value in the OAC Home applicants, offers and acceptances by IMD flag The proportion of those accepted whose home postcode has a matching value in the IMD directory and who are in a flagged quintile is ( *).
5 In addition, ( ) of those accepted had a home postcode with no match or value in the IMD Home applicants, offers and acceptances by ethnicity and gender The proportion of those accepted whose ethnicity is known and who declare they have an ethnic minority background or other is ( ). In addition, ( ) of those accepted chose not to declare their ethnic Applicants, offers and acceptances by disability The proportion of those accepted who declare they have a disability is ( ).* The IMD flag has changed, so last year s summary figure has been re-calculated here on the same basis for ease ofcomparison. From the 2020 cycle onwards, home postcodes in the lowest two IMD quintiles are flagged; prior to this,the lowest three IMD decileswere Applications, offers and acceptances by school /college type4| University of CambridgeTable Applications, offers and acceptances to Cambridge by type of school /college and gender 2020 ApplicationsOffers Acceptances and success rates Type of school /collegeMaleFemale Totals%MaleFemale Totals%MaleFemaleTotals%Success rate (%)
6 Home applicationsMaintained4,7434,4949, ,1071,3592, , School2,5852,4655, , , School1,2491,0582, Form College6516731, and Tertiary ,8491,5873, and ,8876,50113, ,6281,9123, ,4131,7093, and Overseas3,2742,8856, , ,6943,3447, , ,5819,84520, ,2852,4254, ,9012,0963, terms Maintained and Independent refer to UK schools/colleges, so figures provided in the lower half of the table against the Maintained and Independent labels refer toapplicants permanently resident outside the UK applying following education in UK schools/colleges. The Other and Overseas category consists largely of applicants at schools andcolleges outside the UK, but includes applicants from a variety of non- school /college institutions within the UK. Academies in England are counted within the Comprehensive Schoolcategory if their Admissions policy is non-selective, or the Grammar school category if their Admissions policy is applications from Home students attending UK schools/colleges the proportions of acceptances by school /college type are.
7 Maintained ( in the previous cycle)Independent ( in the previous cycle)This table counts all applications, regardless of domicile, but provides a split between Home and all other of Cambridge | 5 Table UK schools/colleges submitting Home applicants, and receiving offers andacceptances to Cambridge in any of the last three years (2018-2020)Academies in England are counted within the Comprehensive school category if their Admissions policy is non-selective,or the Grammar school category if their Admissions policy is table counts the number of UK schools/colleges submitting Home applicants over a three-year of school /collegeApplicationsOffers AcceptancesMaintained2,3571,5021,311 Comprehensive School1,8461,133972 Grammar School224196190 Sixth Form College726357FE and Tertiary Colleges21511092 Independent562386362 Totals2,9191,8881,673 ApplicationsOffers Acceptances and success ratesRegion of rate (%)
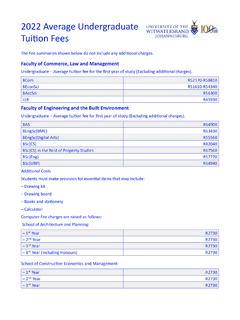
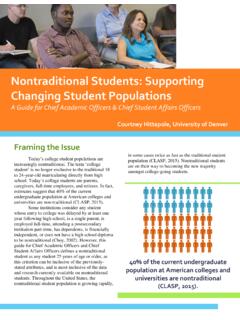
8 Northern Ireland140 East289 Midlands743 & The Humber785 West826 Midlands829 West982 ,772 East2,535 London3,845 ,012 ,388 ,540 ,122 | University of CambridgeTable Home applications, offers and acceptances to Cambridge by UK region 20202 Applications, offers and acceptances by regionThe regions listed are based on applicants Area of Permanent Residence (APR) code, as provided by of applications to Cambridge by region 2020 South EastNorth EastScotlandWalesEast MidlandsYorkshire & The HumberSouth West West MidlandsNorth WestEasternGreater London This table counts Home applications Ireland University of Cambridge | 7 South EastWalesNorth EastEast MidlandsGreater London South WestEasternYorkshire & The HumberNorth WestWest MidlandsNorthern IrelandScotlandSuccess rate by region 20205%0%10%15%20%25%30%8| University of CambridgeTable Applications, offers and acceptances to Cambridge by country 2020 This table lists the top 25 countries outside the UK submitting applications to Cambridge.
9 The countries listed are basedon applicants Area of Permanent Residence (APR) code. Countries submitting fewer applications than those in the top 25are aggregated as Other EU or Other International at the bottom of the table counts applications from outside the UK Acceptances and success ratesCountry of Success rate (%)China1, States of , Republic (European Union) Arab , , Level ApplicationsOffersAcceptancesGradesMale% Female%Total%Male%Female%Total%Male%Fema le%Total%Arts, Humanities and Social SciencesA*A*A* , *A* , *A* *A* * * < , , , , , , , *A*A*2, , , , , *A* , *A* *A* * * < , , , , , , , , , , , , , , Applications, offers and acceptances by A Level profileUniversity of Cambridge | 9 Table Home applications, offers and acceptances to Cambridge by A Level profile and gender 2020 This table counts Home applicants achieving three or more A Levels by the end of the 2020 Admissions cycle this table the three highest A Level grades in all subjects, excluding General Studies and Critical Thinking, are used to establish applicants grade profiles.
10 The <AAA categoryincludes all combinations of A Level grades not listed | University of Cambridge4 Applications, offers and acceptances by subjectMathematics includes those applying for Mathematics and Mathematics with Physics. The courses in Chemical Engineering,Management Studies and Manufacturing Engineering can be taken only after Part I in another subject. Applications, offersand acceptances for these courses are recorded under the first year subjects taken by the applicants Applications, offers and acceptances to Cambridge by subject 2020 This table counts all applications, regardless of Acceptances and success ratesSuccess Degree (%)Arts, Humanities and Social SciencesAnglo-Saxon, Norse, & & Middle Eastern (4 years) , & Modern & of , Social, & Political Sciences1, , & Medieval , Religion & Philosophy of Religion , , , Science1, , , , Graduate Sciences3, & Behavioural , , , , , , of Cambridge | 11 Table Applications, offers and acceptances to Cambridge by subject and gender 2020 ApplicationsOffersAcceptances Degree programmeMale%Female% Male%Female%Male%Female%Arts, Humanities and Social Sciences Anglo-Saxon, Norse, & & Middle Eastern (4 years)