Transcription of Understanding Eye Pattern Measurements Application Note
1 Application Note Understanding Eye Pattern Measurements Introduction The growth of high-speed Internet has driven data-transmission technology to fully commercialize on 10 Gbps data rates for use in metro and access segments of the next generation network. A key enabling component in the physical layer is the transceiver module, which enables vital transmit and receive operations at the end of each fiber optic link. Transceiver modules, such as the XFP/SFP/SFP+ configurations, are governed by Multi-Source Agreements that ensure consistency between suppliers with requirements for eye mask Measurements .
2 These eye mask definitions specify transmitter output performance in terms of normalized amplitude and time in such a way to ensure far-end receivers can consistently tell the difference between one and zero levels in the presence of timing noise and jitter. The measurement instrument that verifies eye mask compliance is commonly referred to as a high-speed sampling oscilloscope. This instrument class measures samples of the input signal to form an eye diagram that can be used for analysis of the signal's noise, jitter, and eye mask compliance.
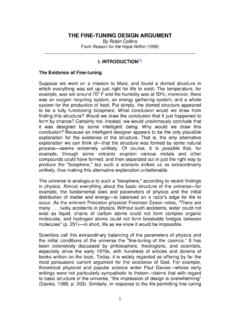
3 The ability to accumulate and display samples supports statistical analysis techniques for assessing the quality of the digital signal, but does not detect protocol or logic problems. The quality of digital signals is simple to see with an eye diagram: Bit-Error-Rate (BER) degrades with eye closure. Figure 1 shows two Anritsu instruments that feature the latest in eye Pattern analysis for manufacturing and field applications . Figure 1. Low-cost, high performance, eye Pattern analyzers are essential tools for verifying that eye mask compliance tests of 10 Gbps transmitter outputs adhere to industry standards.
4 Shown are new instruments from Anritsu, the MP2100A BERTWave and the MP1026B Bit Master . This Application note reviews basic eye diagram definitions and terminologies, and presents several typical examples of measurement applications . Its objective is to present practical information that will help engineers conduct 10 Gbps eye Pattern Measurements using the eye Pattern analyzer. Eye Pattern Fundamentals An eye diagram is a useful tool for Understanding signal impairments in the physical layer of high-speed digital data systems, verifying transmitter output compliance, and revealing the amplitude and time distortion elements that degrade the BER for diagnostic purposes.
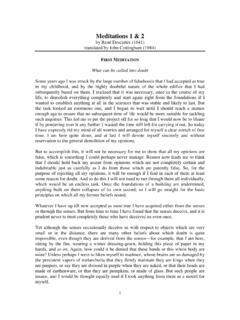
5 By taking high-bandwidth instantaneous samples of a high-speed digital signal, an eye diagram is the sum of samples from superimposing the 1's, 0's, and corresponding transition Measurements . What results is an image that reveals the eye of the eye diagram, as shown in Figure 2. Figure 2. An eye diagram results from superimposing the 0 s and 1 s of a high-speed digital data stream. For easy viewing, the time axis in Figure 2 is normalized for 2 bits, with the 1 bit eye opening in the center of the display and 1/2 bit to the left and right of the center eye for capturing rise/fall-time transitions.
6 Note that any data bits in the rise/fall transitions of the digital signal that infringe on the center of the eye opening may cause data errors and will be discussed later in the Application note. Although the eye Pattern in Figure 2 depicts some noise and jitter, other forthcoming examples will show data system waveforms with considerably more noise and a center eye that closes more significantly. Generally speaking, the more open the eye is (indicated by the arrows in the diagram), the lower the likelihood that the receiver in the transmission system will mistake a logical 1 bit for a logical 0 bit, or vice versa.
7 These logic decisions require a certain margin of signal differential between the 0 and the 1 level. Noise, both amplitude and time jitter, reduces that margin and is logically depicted in Figure 2 as some closure of the eye opening . The ratio of bits that have errors, compared to the overall bits, is called BER. The eye diagram does not show protocol or logic problems. It does, however, allow the engineer to more easily view signal impairments in the physical layer in terms of amplitude and time distortion.
8 Eye Pattern Measurement Technology Sampling oscilloscope technology provides the frequency bandwidth (typically 25 GHz) necessary to capture the full data characteristics of 10 Gbps data waveforms. Modern high-bandwidth sampling oscilloscopes use a low sampling rate (typically under-sampling on the order of 100 ksps) to generate a two-dimensional X versus Y database that statistically represents the time and amplitude of a digital signal. As more samples are accumulated, the database grows in the third dimension (plot density), which represents the number of pixels that fall in the same X-Y.
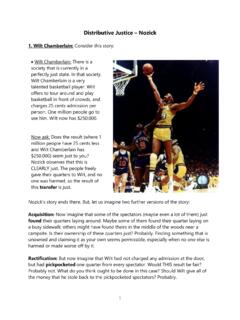
9 Location on the display (Figure 3). The significance of accumulating Measurements for analysis is evident in the side-by-side screen captures in Figure 3. In the left screen capture (8,000 samples), the histogram plot located below the left crossing point indicates that the normal distribution of samples in the window contains only 38 samples. In contrast, the right screen capture (10 million samples) contains nearly 6,000 samples in its histogram. Note that the time histogram of the crossing point data (below the eye diagram) exhibits more of a normal distribution in the right screen capture.
10 Histograms of other amplitude parameters are also possible. The mean, standard deviation and peak-to-peak (p-p) readouts and histograms become more statistically relevant with more samples. Figure 3. Shown here are two displays from a sampling oscilloscope. The left screen shows 8,000 whereas the right screen shows 10 million samples. The additional data enables the more precise measurement of noise and jitter in high-speed digital signals.. Typical Setup for Eye Pattern Measurements For the purposes of this Application note, eye Pattern Measurements require a pulse Pattern generator and eye Pattern analyzer.