Transcription of Understanding Growth : Normal vs. Abnormal …
1 Supported by a grant from The Genentech Foundation for Growth and Development. Thesematerials may be freely reproduced, but may not be modified without written consent of Growth : Normal vs. Abnormal PatternsFacilitator s GuideCase Author:Laurie E. Cohen, MDHarvard Medical SchoolChildren s Hospital, BostonCase Advisors:S. Jean Emans, MDJohn R. Knight, MDHarvard Medical SchoolChildren s Hospital, BostonTopic: Understanding GrowthAbstract: Growth problems are common in children and adolescents. Every child should have his/herheight and weight plotted on an appropriate Growth chart as part of routine medical abnormalities will often present first to the primary care clinician. Therefore, cliniciansmust know how to plot Growth , be able to discriminate Normal from pathological Growth , andknow when referral to an endocrinologist is warranted.
2 This educational exercise includes aseries of brief patient vignettes with corresponding Growth charts. Each vignette will prompt adiscussion of the likely diagnosis and the next step in patient management. Goal: To improve clinical skills in recognizing and evaluating children with Growth :As a result of this training, clinicians will be able to:1. To monitor and record Growth To recognize Abnormal Growth To identify common etiologies of Growth To begin a diagnostic evaluation when a Growth disorder is Case: N/ARelated Case(s): Timmy and the Big Kids (Constitutional Short Stature) The Shortest in the Class (Turner s Syndrome and Short Stature) Different From My Friends (Turner s Syndrome and Delayed Puberty) Will I Ever Get My Period? ( Growth and Chronic Disease)Themes: Growth in Children and AdolescentsKey Words:Bone age, malnutrition, Growth hormone, hypothyroidism, short statureBright Futures Core Concepts:While all of the Core Concepts are included in each case, this particular case can be used tohighlight communication, advocacy, and prevention/health Provided: Facilitator s Guide 10 plotted Growth charts with brief patient vignette Handout on Systemic Disorders That Affect Growth (for Cases 4 & 7)Facilitator Preparation:Facilitators should thoroughly review this guide and the other materials provided.
3 Prepareenough photocopies of the case vignettes and accompanying Growth charts for your group oflearners. You may wish to create overheads of all Growth charts Format for a One Hour Session:We anticipate that case facilitators will modify implementation of the case session tobest fit their educational setting and learners. Facilitators should decide how many ofthe 10 case scenarios they wish to present in their allotted time. They may distributethe cases before the teaching session, and ask the learners to select particular casesfor discussion. If all 10 cases are planned for discussion, an additional one-hoursession may be required. For detailed recommendations on case facilitation, pleasesee the previous chapter entitled, A Brief Guide to Facilitating Case Discussion. Open the Discussion: Introduce the session goal.
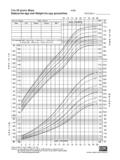
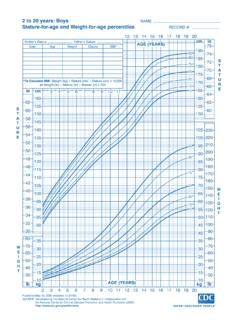
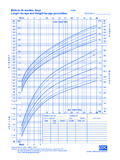
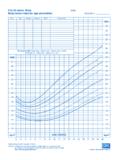
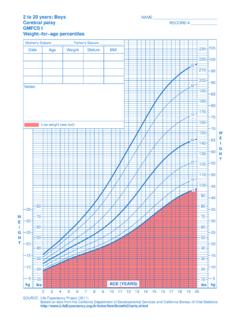
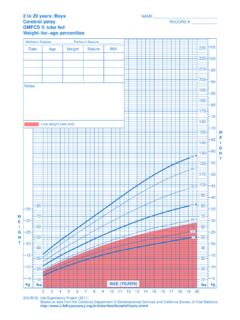
4 Explain that this will be aninteractive case discussion and not a lecture. Ask participants What do you knowabout Growth rates in children? After several minutes of discussion, introduce anoverview on Plotting : Overview on Plotting GrowthPrimary care pediatricians should record Growth information on every child. The mostcommonly used Growth charts are from the National Center for Health Statistics (NCHS) andare age and gender specific ( ):1) Birth to 36 Monthsa) Derived from a small sample of predominantly white, middle-class children (thesepercentiles may not be valid for other ethnic groups, but Growth patterns should be similar)b) Infants are measured supinec) There is an overlap between these charts and the 2 to 20 years Growth charts;however, there is a small loss in height when a child is measured in a standing position, soheight may not plot to the same percentile level on both ) 2-20 yearsSeparate NCHS charts, based on a large cross-sectional sampling of North Americanchildren, have been created to track Growth in boys and girls that provide the normativecurves +/- 2 SD for both height and weight ensure accuracy and reliability, clinicians should: Use proper equipment ( , stadiometer) to facilitate more accurate measurements (thefloppy arm scales are inherently variable and can yield inaccurate results).
5 Obtain 2-3 measurements Check the child's position before each measurement Plot correctly on appropriate Growth chartWarning signals of subnormal Growth : Abnormally slow Growth rate- Ages 3 years to puberty, less than 2 inches/ year (5 cm/ year ) with downwardcrossing of centile channels on Growth chart after age of 18 months (just prior to theonset of puberty, the Growth rate may dip to 4 cm/ year ) Height below the 3rd percentile Height significantly below genetic potential, , >2 SD below mid-parental heightNote: Underweight for height may indicate a systemic disease with decreasednutritional intake, malabsorption, or increased energy requirements ( ,cardiac or respiratory disease). Overweight for height may indicate endocrinedisorders ( , Growth hormone deficiency, hypothyroidism, or cortisol excess.)
6 Mid-parental Height: This calculation provides a target mean and range for the geneticpotential of a child based upon the biologic parents' heights. This calculation alone is notsufficient to predict final height; it only calculates a reference range for assessing height = (father's height - 5 in.) + (mother's height)for girls (inches) 2mid-parental height = (mother's height + 5 in.) + (father's height)for boys (inches) 2 Target height = mid-parental height 2 SD (1 SD = 2 in.)Short Stature: What is the Normal Growth rate during childhood? Most children establish apattern of Growth by 3 years of age and do not deviate from this pattern until the onset ofpuberty. During this time, the Normal Growth rate is inches/ year ( cm/ year ). Whenpatients in this age group cross over or change Growth channels, this may signal a growthproblem and should be evaluated further evaluation is necessary, it is important to determine whether a patient sheight is caused by constitutional Growth delay and/or familial short stature.
7 Is the child healthyand on track for attaining adequate adult height? Or is his shortness within Normal limits whenconsidering his parents heights? If neither of these scenarios is the case, then the clinician mustconsider the possible pathologic origins of short stature and poor term short stature has been defined as height below the 3rd percentile. Extremeshort stature is defined as height more than 3 standard deviations from the the participants What would you like to focus on during our discussion today? List agenda items on a blackboard or the first Growth chart and ask one of the participants to read the patientvignette aloud. Following this reading, ask all participants, What do you think aboutthis child? Remember that the key to successfully leading a small group isfacilitation of the discussion rather than lecture.
8 Draw as many participants aspossible into the discussion. As you ask additional questions, allow silences whilegroup members consider their answers/comments. You should further developdiscussion by asking, What is the next step in clinical management? and What isthe most likely diagnosis? Follow the same procedure for additional You may elect to give participants copies of the discussion guide orcopies of other materials such as journal articles. Ask the group how furtherinformation might be obtained, reviewing the reference list and other sources ofinformation. Understanding Growth : Normal vs. Abnormal PatternsCase 1 Facilitator s is an 11 year old girl who has always been short for her age. Her mother is 5 0 , herfather is 5 5 . Her physical exam is Normal , and her breasts are Tanner II, pubic hair is What should you do next?
9 (select as many as apply)a) calculate mid-parental heightb) obtain bone agec) laboratory screeningd) re-plot on a specialized Growth chartAnswer: (a) Calculate mid-parental Teaching Points: Pediatricians should know how to calculate mid-parental height andtarget height for boys and girls. Target height for this patient is 5 0 .2. The most likely diagnosis is (select one answer):a) familial short statureb) constitutional delayc) Turner s Syndromed) Down SyndromeAnswer: (a) Familial short stature. This is not constitutional delay because there is not a historyof delayed Teaching Points: Familial (or genetic) short stature is characterized by: Family history of short stature Birth weight > kg Height < 3rd percentile for chronologic age Growth curve parallel but at or below 3rd percentile Predicted adult height < 3rd percentile No organic or emotional cause for Growth failure Normal annual Growth rate and bone age Normal pubertal onset and maturationCase 2 Facilitator s is a 12 year old boy who has always been shorter than his peers.
10 His mother is 5 1 , andhis father is 5 6 . His mother had menarche at age 15 years; his father had late pubertaldevelopment. His physical examination is unremarkable, with pubertal development Tanner What should you do next? (select as many as apply)a) calculate mid-parental heightb) obtain bone agec) laboratory screeningd) re-plot on a specialized Growth chartAnswers: (a), (b), and (d)Key Teaching Points:(a) Calculate mid-parental height (Facilitator Introduction). His mid-parental height is 5 6 .(b) Obtain bone age (a radiograph of the left wrist and hand) Bone age is a measurement of epiphyseal ossification of the bones in the hand and wrist,including appearance and progression of size and shape. Comparison to the standards of Greulich and Pyle or the Tanner-Whitehouse scoringsystem is used for each bone.