Transcription of Unemployment rates - ec.europa.eu
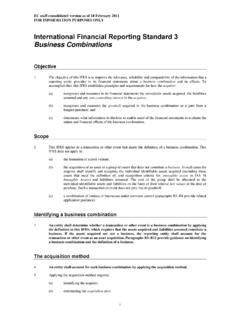
1 4/2021 10 January 2022 November 2021 Euro area Unemployment at EU at In November 2021, the euro area seasonally-adjusted Unemployment rate was , down from in October 2021 and from in November 2020. The EU Unemployment rate was in November 2021, down from in October 2021 and from in November 2020. These figures are published by Eurostat, the statistical office of the european Union. Eurostat estimates that million men and women in the EU, of whom million in the euro area, were unemployed in November 2021. Compared with October 2021, the number of persons unemployed decreased by 247 000 in the EU and by 222 000 in the euro area. Compared with November 2020, Unemployment decreased by million in the EU and by million in the euro area. 6789101112 IIIIIIIVIIIIIIIVIIIIIIIVIIIIIIIVIIIIIIIV IIIIIIIVIIIIIIIVIIIIIIIVIIIIIIIVIIIIIIIV IIIIIIIVIIIIIIIVIIIIIIIVIIIIIIIV20082009 2010201120122013201420152016201720182019 20202021 Unemployment ratesseasonally adjusted series, %Euro areaEU Youth Unemployment In November 2021, million young persons (under 25) were unemployed in the EU, of whom million were in the euro area.
2 In November 2021, the youth Unemployment rate was in the EU and in the euro area, down from in the EU and from in the euro area in the previous month. Compared with October 2021, youth Unemployment decreased by 34 000 in the EU and by 37 000 in the euro area. Compared with November 2020, youth Unemployment decreased by 225 000 in the EU and by 188 000 in the euro area. Unemployment by gender In November 2021, the Unemployment rate for women was in the EU, down from in October 2021. The Unemployment rate for men was in November 2021, down from in October 2021. In the euro area, the Unemployment rate for women decreased from in October 2021 to in November 2021, while the Unemployment rate for men decreased from to Additional labour market indicators These estimates are based on the globally used International Labour Organisation (ILO) standard definition of Unemployment , which counts as unemployed people without a job who have been actively seeking work in the last four weeks and are available to start work within the next two weeks.
3 The COVID-19 outbreak and the measures applied to combat it have triggered a sharp increase in the number of claims for Unemployment benefits across the EU. At the same time, a significant part of those who had registered in Unemployment agencies were no longer actively looking for a job or no longer available for work, for instance, if they had to take care of their children. This leads to discrepancies in the number of registered unemployed and those measured as unemployed according to the ILO definition. To capture in full the unprecedented labour market situation triggered by the COVID-19 outbreak, the data on Unemployment have been complemented by additional indicators, underemployed part-time workers, persons seeking work but not immediately available and persons available to work but not seeking, released together with LFS data for the second quarter of 2021.
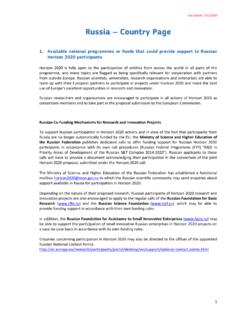
4 LFS data for the third quarter of 2021 will be released on 13 January 2022. 14161820222426 IIIIIIIVIIIIIIIVIIIIIIIVIIIIIIIVIIIIIIIV IIIIIIIVIIIIIIIVIIIIIIIVIIIIIIIVIIIIIIIV IIIIIIIVIIIIIIIVIIIIIIIVIIIIIIIV20082009 2010201120122013201420152016201720182019 20202021 Youth Unemployment ratesseasonally adjusted series, %Euro areaEU Geographical information Euro area (EA19): Belgium, Germany, Estonia, Ireland, Greece, Spain, France, Italy, Cyprus, Latvia, Lithuania, Luxembourg, Malta, the Netherlands, Austria, Portugal, Slovenia, Slovakia and Finland. european Union (EU27): Belgium, Bulgaria, Czechia, Denmark, Germany, Estonia, Ireland, Greece, Spain, France, Croatia, Italy, Cyprus, Latvia, Lithuania, Luxembourg, Hungary, Malta, the Netherlands, Austria, Poland, Portugal, Romania, Slovenia, Slovakia, Finland and Sweden. Methods and definitions Eurostat publishes harmonised Unemployment rates for individual EU Member States, the euro area and the EU.
5 These Unemployment rates are based on the definition recommended by the International Labour Organisation (ILO). The measurement is based on a harmonised data source, the european Union Labour Force Survey (LFS). Based on the ILO definition, Eurostat defines unemployed persons as persons aged 15 to 74 who: - are without work; - are available to start work within the next two weeks; - and have actively sought employment at some time during the previous four weeks. The Unemployment rate is the number of people unemployed as a percentage of the labour force. Series have been seasonally adjusted using the seasonal factors estimated in the period up to December 2019 included. Those seasonal factors will be kept unchanged ( controlled concurrent adjustment method ) until the impact of the COVID-19 outbreak can be integrated in seasonal adjustment models. The labour force is the total number of people employed plus unemployed.
6 In this news release Unemployment rates are based on employment and Unemployment data covering persons aged 15 to 74. The youth Unemployment rate is the number of people aged 15 to 24 unemployed as a percentage of the labour force of the same age. Therefore, the youth Unemployment rate should not be interpreted as the share of jobless people in the overall youth population. When data for the most recent month are not available for a Member State, EU and EA aggregates are calculated using the latest data available for that Member State. Country notes Germany, the Netherlands, Finland, Sweden and Iceland: the trend component is used instead of the more volatile seasonally adjusted data. Denmark, Estonia and Portugal: 3-month moving averages of LFS data are used instead of pure monthly indicators. Austria and Italy: the data are provisional up to November 2021 included. Revisions and timetable The data in this News Release can be subject to revisions, caused by updates to the seasonally adjusted series whenever new monthly data are added; the inclusion of the most recent LFS data in the calculation process; update of seasonal adjustment models with complete annual data.
7 Compared with the rates published in News Release 134/2021 of 2 December 2021, the Unemployment rate for October 2021 remained unchanged for the euro area and the EU. Among EU Member States, the rate has been revised by more than percentage points (pp) downwards for Estonia (by pp), Bulgaria and Poland (both by pp), Belgium (by pp) and Finland (by pp). The rate has been revised by more than percentage points upwards for Greece (by pp) and Croatia (by pp). For more information Eurostat website section on employment and Unemployment Eurostat database section on Unemployment , including non-seasonally adjusted and trend data Eurostat Statistics Explained articles on Unemployment and on youth Unemployment Eurostat metadata on adjusted Unemployment series and methodological note regarding COVID-19 outbreak Eurostat -indicators release calendar european Statistics Code of Practice Eurostat Press Office Veronika LANG Tel: +352-4301-33 408 For further information on data Boyan GENEV Tel: +352-4301-36 409 Thibaut HENRION Tel: +352-4301-31 686 Media requests: / Tel.
8 +352-4301-33 408 @EU_Eurostat @EurostatStatistics @EU_Eurostat Seasonally adjusted Unemployment , totals rates (%) Number of persons (in thousands) Nov 20 Aug 21 Sep 21 Oct 21 Nov 21 Nov 20 Aug 21 Sep 21 Oct 21 Nov 21 Euro area 13 240 12 343 12 117 12 051 11 829 EU 15 643 14 598 14 314 14 231 13 984 Belgium 291 329 324 315 304 Bulgaria 176 160 159 159 162 Czechia 159 151 139 138 121 Denmark 178 147 156 155 154 Germany 1 751 1 449 1 422 1 402 1 390 Estonia 52 41 40 36 35 Ireland 150 139 134 135 136 Greece 748 657 618 620 636 Spain 3 719 3 439 3 398 3 367 3 279 France 2 367 2 403 2 340 2 290 2 262 Croatia 153 142 137 131 127 Italy 2 392 2 334 2 325 2 381 2 338 Cyprus 36 32 29 31 30 Latvia 78 69 66 66 69 Lithuania 137 103 99 96 88 Luxembourg 20 17 17 16 16 Hungary 208 198 172 187 184 Malta
9 12 10 10 10 10 Netherlands 378 301 292 277 251 Austria 278 268 237 265 244 Poland 547 530 519 515 512 Portugal 368 325 328 330 327 Romania 517 438 423 424 432 Slovenia 55 48 49 50 51 Slovakia 192 183 179 177 176 Finland 222 214 209 204 200 Sweden 492 488 483 477 471 Iceland 14 11 11 11 11 Norway * : 149* 116 104 105 : Switzerland : : 256 245 244 : : United States 10 813 8 397 7 755 7 442 6 971 : Data not available * October 2020 Source datasets: une_rt_m ( rates ) and une_rt_m (in 1 000 persons) Seasonally adjusted youth (under 25s) Unemployment rates (%) Number of persons (in thousands) Nov 20 Aug 21 Sep 21 Oct 21 Nov 21 Nov 20 Aug 21 Sep 21 Oct 21 Nov 21 Euro area 2 501 2 376 2 370 2 350 2 313 EU 3 067 2 901 2 892 2 876 2 842 Belgium : : 56 78 78 : : Bulgaria 21 20 21 19 18 Czechia 24 22 17 21 18 Denmark 52 44 51 51 49 Germany 337 285 281 278 276 Estonia 11 7 7 8 8 Ireland 45 37 36 36 38 Greece 77 72 60 76 94 Spain 581 497 492 502 493 France 542 642 633 603 586 Croatia : : 32 29 29 : : Italy 433 399 437 422 410 Cyprus : : 7 6 6.
10 Latvia 7 9 9 9 9 Lithuania 19 15 14 14 13 Luxembourg 5 4 4 4 4 Hungary 42 49 30 41 38 Malta 3 2 2 2 2 Netherlands 138 110 110 104 91 Austria 59 56 47 52 50 Poland 147 106 106 116 125 Portugal 75 75 73 71 72 Romania : : 116 107 107 : : Slovenia : : 9 10 10 : : Slovakia 31 28 26 27 28 Finland 63 55 54 54 54 Sweden 148 156 155 154 153 Iceland 3 3 3 3 3 Norway : 42 42 36 38 : Switzerland : : 45 47 48 : : : Data not available Belgium, Croatia, Cyprus, Romania and Slovenia: quarterly data Source datasets: une_rt_m ( rates ) and une_rt_m (in 1 000 persons) Seasonally adjusted Unemployment rates (%), by gender Males Females Nov 20 Aug 21 Sep 21 Oct 21 Nov 21 Nov 20 Aug 21 Sep 21 Oct 21 Nov 21 Euro area EU Belgium Bulgaria Czechia Denmark Germany Estonia Ireland Greece Spain France Croatia Italy Cyprus Latvia Lithuania Luxembourg Hungary Malta Netherlands Austria Poland Portugal Romania Slovenia Slovakia Finland Sweden Iceland