Transcription of Union Membership In The United States - Bureau of Labor ...
1 Bureau OF Labor STATISTICSS potlight on StatisticsPage 1 SEPTEMBER 2016 Union Membership In The United StatesMegan Dunn and James WalkerUnion Membership has declined steadily since 1983, the earliest year for which strictly comparable data are available. Even private-sector industries with a relatively high concentration of Union members, such as transportation and manufacturing, have experienced declining Membership rates. In contrast, Union Membership rates in the public sector, which are much higher than in private industries, have held fairly steady since the early 1980s. The Union Membership rate is the proportion of employed wage and salary workers who are Union spotlight on statistics examines historical trends in Union Membership among employed wage and salary workers.
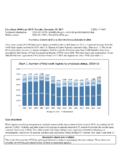
2 It also examines Union Membership by a variety of demographic characteristics. Bureau OF Labor STATISTICSS potlight on StatisticsPage 2 Union Membership rate in 2015 about half the 1983 rateThe number of employed Union members has declined by million since 1983. During the same time, the number of all wage and salary workers grew from million to million. Consequently, the Union Membership rate was percent in 1983 and declined to percent in 2009, there was a sharp decline in the number of workers overall and in the number of Union members. The number of wage and salary workers declined by million from 2008 to 2009, and the number of employed Union members fell by 771,000. However, the Union Membership rate was percent in 2009, essentially unchanged from percent in 2008.
3 Bureau OF Labor STATISTICSS potlight on StatisticsPage 3 Number of Union members about evenly split between the private and public sector in 2015 Through the years, there has been a long term decline in the number of Union members in the private sector. In 2015, there were million Union members in the private sector, million fewer than in 1983. Public-sector Union Membership , however, has remained fairly constant over time; in 2015, there were million public-sector Union members, million more than in 1983. Bureau OF Labor STATISTICSS potlight on StatisticsPage 4 Union Membership rate highest in local governmentIn 2015, public-sector workers had a Union Membership rate of percent, more than five times higher than that of private-sector workers ( percent).
4 While the unionization rate for the public sector has remained relatively steady over time, the rate for the private sector has declined from percent in 1983 to percent in the public sector, local government had the highest Union Membership rate at percent in 2015, followed by state government at percent and federal government at percent. Local government has a large number of Union members working in highly unionized occupations such as teachers, police officers, and firefighters. Bureau OF Labor STATISTICSS potlight on StatisticsPage 5 Industries with large numbers of Union members experienced declining rates tooIn the private sector, five industries accounted for 81 percent of Union members in 2015.
5 Of these industries, private education and health services had the largest number of Union members at million; this includes a large number of Union members who work in private hospitals, like nurses, and private school employees (public schools and hospitals are excluded). Manufacturing ( million), transportation and utilities ( million), construction (940,000), and wholesale and retail trade (871,000) also had relatively large numbers of Union members in 2015. For comparison, the sixth largest industry, leisure and hospitality had 389,000 Union , which has a relatively high Union Membership rate, declined by percentage points from 2000 to 2015. Union Membership rates in construction, manufacturing, and wholesale and retail trade also declined.
6 In contrast, the unionization rate in education and health services edged up by percentage point. Industry data on a comparable basis are available back to 2000. Bureau OF Labor STATISTICSS potlight on StatisticsPage 6 New York had highest Union Membership rate, South Carolina lowest, in 2015 Thirty States and the District of Columbia had Union Membership rates below that of the average, percent, and 20 States had rates above it. In 2015, New York continued to have the highest Union Membership rate at percent; Hawaii was the only other state to have a Union Membership rate above 20 percent in 2015, at percent. Five States had Union Membership rates below percent in 2015, with South Carolina having the lowest rate ( percent).
7 The next lowest rates were in North Carolina ( percent) and Utah ( percent). Bureau OF Labor STATISTICSS potlight on StatisticsPage 7 Union members median weekly earnings are higher than earnings of nonunion workersIn 2015, full-time wage and salary workers who were Union members had median usual weekly earnings of $980, while nonunion workers had median weekly earnings of $776, or 79 percent of Union members earnings. Since 1983, nonunion workers earnings have remained just under 80 percent of Union members earnings. In addition to coverage by a collective bargaining agreement, this earnings difference reflects a variety of influences, including variations in the distributions of demographic characteristics among Union members and nonunion workers by age, occupation, industry, firm size, or geographic region.
8 Bureau OF Labor STATISTICSS potlight on StatisticsPage 8 Workers ages 45 to 64 have highest Membership ratesIn 2015, Union Membership rates were highest among workers ages 45 to 64 percent for those ages 45 to 54 and percent for those ages 55 to 64. Nearly half of all Union members were between 45 and 64 years old in 2015, but only about one-third of nonunion workers belonged in these age groups. Workers ages 45 to 64 were heavily represented in the manufacturing and transportation industries, which also had relatively high unionization lowest Union Membership rate was among workers ages 16 to 24 ( percent). Workers ages 16 to 24 made up a smaller share of Union members than nonunion workers. Bureau OF Labor STATISTICSS potlight on StatisticsPage 9 Bureau OF Labor STATISTICSS potlight on StatisticsPage 10 Union Membership rate highest for Black workersIn 2015, Black workers had a Union Membership rate of percent, compared with percent for Whites, percent for Asians, and percent for Hispanics.
9 The high unionization rate for Blacks partially reflects their heavy representation in the public sector: in 2015, Black workers accounted for percent of total employment but percent of government employment. Bureau OF Labor STATISTICSS potlight on StatisticsPage 11 Men s Union Membership rate has fallen faster than women sIn 1983, men's Union Membership rate was nearly double women's Membership rate. Over time, the Membership rate for men has declined noticeably faster than the rate for women. By 2015, the rates nearly met, with men's rate at percent and women's at percent. This compares with percent for men and percent for women in 1983. Bureau OF Labor STATISTICSS potlight on StatisticsPage 12 Most private-sector Union members are men; most public-sector members are womenThere were more women Union members working in the public sector than in the private sector in 2015.
10 Women made up the majority of public-sector Union members, but only about one-third of private-sector Union government employed the most Union members in the public sector. In local government, women accounted for roughly 6 in 10 Union members, partially reflecting the large number of women employed as public-school teachers, a highly unionized occupation. Bureau OF Labor STATISTICSS potlight on StatisticsPage 13 More informationMegan J. Dunn and James A. Walker are economists in the Office of Employment and Unemployment statistics , Bureau of Labor statistics . You can contact them at and Information on Union Membership has been collected on a regular basis in the Current Population Survey since 1983.
