Transcription of Unit 5: Principles and Applications of Science II
1 Write your name here Surname Other names Pearson Centre Number Learner Registration Number BTEC Level 3. Nationals Diploma Applied Science unit 5: Principles and Applications of Science II. Thursday 25 January 2018 Morning Paper Reference Time: 2 hours 30 minutes 31627H. You must have: Total Marks Calculator Instructions Use black ink or ball-point pen. Fill in the boxes at the top of this page with your name, centre number and learner registration number. Answer all questions. there may Answer the questions in the spaces provided be more space than you need. You must attempt all three sections but you may complete them in any order.
2 Information The total mark for this paper is 120. Section The paper is comprised of three sections worth 40 marks each. A: Organs and systems (Biology). Starts on page 3. Section B: Properties and uses of substances ( chemistry ). Starts on page 16. Section C: Thermal physics, materials and fluids (Physics). Starts on page 27. The marks for each question are shown in brackets use this as a guide as to how much time to spend on each question. The periodic table of elements and formulae sheet can be found at the back of this paper. Advice Read each question carefully before you start to answer it. Try to answer every question.
3 Check your answers if you have time at the end. Turn over *P51724RA0140*. P51724RA. 2018 Pearson Education Ltd. 1/1/1/1/1/1/1/1/1/1. BLANK PAGE. 2. *P51724RA0240*. Applied Science unit 5: Principles and Applications of Science II. Biology SECTION A: ORGANS AND SYSTEMS. *P51724RA0340*. 3. Turn over Answer ALL questions. Write your answers in the spaces provided. Some questions must be answered with a cross in a box . If you change your mind about an answer, put a line through the box and then mark your new answer with a cross . SECTION A: ORGANS AND SYSTEMS. 1 Figure shows part of the respiratory system.
4 Figure (a) (i) Identify the name of structure A in Figure (1). A alveoli B bronchus C larynx D trachea (ii) Name the structure labelled B in Figure (1).. 4. *P51724RA0440*. (b) Paragraph describes the volume and pressure changes that occur in the thorax during expiration. A. During expiration, the external intercostal muscles .. and the ribcage moves down and in. The diaphragm moves up. This causes the volume to B.. C. and the pressure to .. inside the thorax. Paragraph (i) Identify the missing word A in Paragraph (1).. (ii) Identify the missing word B in Paragraph (1).. (iii) Identify the missing word C in Paragraph (1).
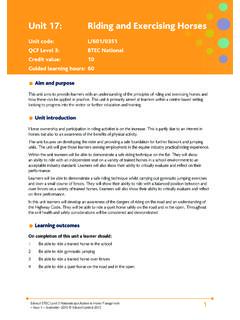
5 *P51724RA0540*. 5. Turn over (c) Figure shows a peak flow meter. Peak flow meters measure the speed of expiration. Doctors can use peak flow meters to help diagnose patients with asthma. Figure 6. *P51724RA0640*. Figure shows a peak flow rate graph of a patient with asthma before and after treatment. 500. 450. Peak Flow Rate (P minute-1). 400. 350. 300. 250. 200. 150. 100. 50. 0. 1 2 3 4 5 6 7 8 9 10 11 12 13 14. Days Figure (i) Identify the day on which the treatment for asthma began. (1). A day 2. B day 6. C day 10. D day 12. (ii) Calculate the percentage increase in peak flow rate between day 1 and day 14.
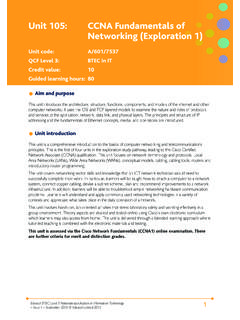
6 (2). Show your working.. %. (Total for Question 1 = 8 marks). *P51724RA0740*. 7. Turn over 2 Figure shows the structure of a cell surface membrane. Amino acids Outside the cell phospholipid bilayer Inside the cell Figure (a) Amino acids are required inside the cell for protein synthesis. Amino acids cannot pass through the phospholipid bilayer. Describe, using information from Figure , how the amino acids enter the cell. (2).. 8. *P51724RA0840*. Figure shows the structure of a phospholipid molecule. Fatty acid tail Phosphate head Figure (b) (i) Explain how the properties of the phosphate head cause it to face the watery exterior and interior areas.
7 (2).. (ii) Explain how the properties of the fatty acid tails cause them to face away from the watery exterior and interior areas. (2).. (Total for Question 2 = 6 marks). *P51724RA0940*. 9. Turn over 3 (a) Figure shows a section of the human heart. X and Y are valves in the heart. X. Y. (Source: WoZJvUCloQc/s1600/Simple%2 BHeart% ). Figure (i) Name valves X and Y. (2). X .. Y .. (ii) Describe the function of the heart valves X and Y. (3).. 10. *P51724RA01040*. (b) There are changes in blood pressure during the cardiac cycle. These changes are brought about by the contraction and relaxation of heart muscle.
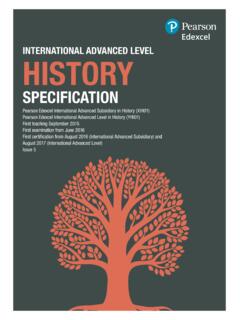
8 Table refers to two phases of the cardiac cycle. Complete Table by stating whether the atria and ventricles are contracted or relaxed in each of these phases. (2). Phase of cardiac cycle atria ventricles ventricular systole cardiac diastole Table Figure shows changes in blood pressure in the aorta and the left ventricle during the cardiac cycle. 20. Blood pressure/kPa 15. aorta 10. 5. left ventricle 0. 0 Time/s Figure (c) Calculate the heart rate using information from Figure (3). Show your working.. beats per minute *P51724RA01140*. 11. Turn over (d) Explain why during ventricular systole, the pressure in the right ventricle is different from the pressure in the left ventricle.
9 (3).. (Total for Question 3 = 13 marks). 12. *P51724RA01240*. 4 The kidneys are organs of excretion and osmoregulation. Patients with kidney failure may have dialysis to treat their condition. During dialysis blood is taken out of the body and passed through a dialysis machine. The dialysis machine contains partially permeable membranes that separate blood from dialysis fluid. Figure shows part of a dialysis machine. Blood in Dialysis fluid with waste Fresh dialysis Blood out fluid Figure *P51724RA01340*. 13. Turn over (a) Explain why the concentration of sodium ions in fresh dialysis fluid should be the same as the normal concentration of sodium ions in blood.
10 (3).. (b) The concentration of ions in blood plasma is continually monitored by osmoreceptors in an area of the brain. When the concentration is too high, antidiuretic hormone (ADH) is released from the pituitary gland. The ADH is carried in the blood and acts on the kidneys. Explain how ADH is involved in osmoregulation in the kidneys. (4).. (Total for Question 4 = 7 marks). 14. *P51724RA01440*. 5 Cardiovascular disease (CVD) affects the heart and blood vessels. Coronary heart disease and strokes are types of cardiovascular disease. High levels of low-density lipoprotein (LDL) cholesterol in the blood is one risk factor for CVD.