Transcription of Unit I: Basic Economic Concepts Problem Set #1
1 Unit I: Basic Economic Concepts Problem Set #1 1. Complete each of the following tasks with short paragraphs: A. Define scarcity and explain how it is related to choices and trade-offs (____/3) B. Fully explain the difference between the following (USE EXAMPLES FOR EACH): i. Trade offs and Opportunity Cost (____/3) ii. Price and Cost (____/3) iii. Normative and Positive Economics (____/3) iv. Consumer Goods and Capital Goods (____/3) v. Allocative and Productive Efficiency (_____/3) vi. Resource Markets and Product Markets (____/3) vii. Free-Market and Centrally Planned Economies (_____/3) 2. Draw a Production Possibilities Graph for the Ford Motor Co. using the following information: (____/5 A B C D E F G Trucks 0 20 28 35 40 43 45 Cars 54 52 49 43 35 25 0 A.)
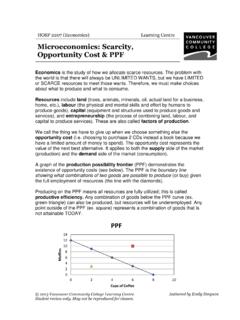
2 What are the consequences of Ford producing at combination A? Combination G? In reality, are either combinations desirable? Why? Why not? (____/5) B. Plot the combination with 30 cars and 40 trucks and label it Y. Plot the combination with 40 cars and 50 trucks and label it X. Explain what is happening at these points? (____/5) C. Explain, with examples, how your graph shows 5 Concepts : opportunity costs, efficiency, unemployment, the law of increasing opportunity costs, and Economic growth. (____/11) 3. Use the PPF-A and PPF-B on the back of this paper to answer the following: A. On PPF-A, what is the opportunity cost from point a to b in terms of guns? What about moving from b to c? What generalizations can you make? (____/5) B.
3 On PPF-B, what is the opportunity cost from point a to b in terms of guns? What is the PER UNIT OPPORTUNITY COST from moving from c to e? (____/5) C. Which PPF shows increasing opportunity costs? Use numerical examples to explain why? (____/5) D. Fully explain three specific situations that would shift PPF-B outward. Draw and label these changes on three separate graphs. (____/5) 4. Complete the handout entitled Microeconomics: Lesson 2, Activity 2 (____/10) 5. The following figures represent the amount that can be produced with a fixed amount of factor inputs. Bananas Sugarcane Jamaica 100 50 Puerto Rico 160 40 A. Which country has the absolute advantage in bananas? Which country has the absolute advantage in sugarcane? Explain how you arrive at that answer?
4 (____/5) B. What is Jamaica s opportunity cost for producing one unit of bananas? What is Puerto Rico s opportunity cost for producing one unit of sugarcane? (____/5) C. Which country has the comparative advantage in bananas? Which country has the comparative advantage in sugarcane? Explain how you arrive at that answer? (____/5) D. Should these countries trade? If so, how should they specialize and why? (____/5)
