Transcription of United States Department of Agriculture Oilseeds: World ...
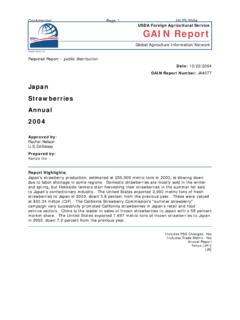
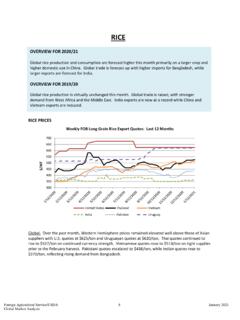
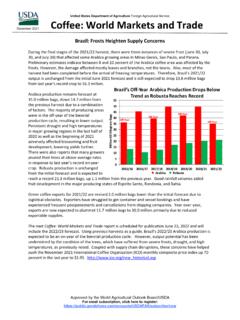
1 United States Department of Agriculture Foreign Agricultural Service Approved by the World Agricultural Outlook Board/USDA June 2020 Sunflower Oil Claims Record Share of Food Use Sunflower oil will claim a record share of global food use in MY 2019/20, rising to 12 percent. The shift towards sunflower is driven by demand for higher-quality oils as global incomes rise, resulting in consistent production growth particularly in Ukraine and Russia. Since 2011, sunflower oil production has expanded faster than any other oil, averaging almost 7 percent growth per year. This trend accelerated in 2019/20 as palm and rapeseed oil production fell due to unfavorable weather and planting decisions affected by China trade concerns, respectively.
2 Attractive prices made sunflower oil a good value for price option in early 2020, resulting in elevated imports. Vegetable oil prices converged at the start of 2020, encouraging expanded purchases of typically higher-value oils including sunflowerseed. Sunflower oil remained cheaper than rapeseed oil from mid-February to early April, which incentivized purchases. China imports of sunflower oil hit an all-time high for the month of April, reaching 251,000 tons, up 85 percent from the previous record in April 2016. Sunflower oil has claimed a higher share of China s oil for food use over time and will account for roughly 6 percent of the country s food oil use in MY 2019/20, double its share in MY 2012/13.
3 Despite this flurry of trade, elevated imports of sunflower oil are unlikely to continue into the summer. The Eurasian Economic Union s decision in April 2020 to ban sunflowerseed exports limits input for external crushers and is expected to slow sunflower oil production. As the ban is causing prices to rise, the restricted supply and higher cost may turn importers to substitute oils. Global demand for all oils is expected to slow in response to the economic impact of the pandemic and increase in-home cooking, holding oil consumption in MY 2019/20 flat from last year. While still short of the 3 percent food consumption growth prior to the pandemic, oil consumption is forecast to recover in MY 2020/21, growing at 2 percent.
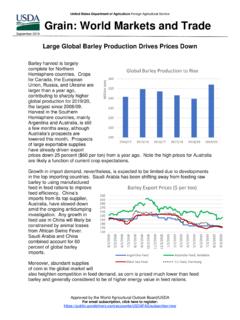
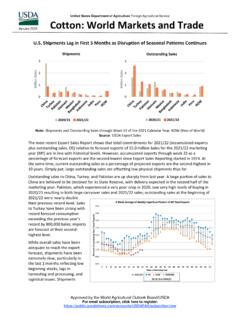
4 9%10%11%12%13%0510152011/1212/1313/1414/ 1515/1616/1717/1818/1919/20 Million TonsGlobal Sunflower Oil Food UseGlobal Food ConsumptionShare of Total Food Consumption EXPORT PRICES Gulf FOB soybean export bids in May averaged $335/ton, down $2 from April. Brazil Paranagua FOB averaged $338/ton, up $4 from last month while Argentina Up River FOB averaged $329/ton, up $2. Early June prices indicate a rising trend in prices relative to Brazil. Argentine farmers remain reluctant sellers in response to uncertainty over a possible devaluation of the peso. Global soybean meal and oil demand remained weak for much of the month in response to COVID-19 s impact.
5 soybean meal export bids continued to fall in May, averaging $331/ton, down $18 from April. Brazil and Argentina export prices strengthened during the first half of May before weakening the rest of the month. Brazil Paranagua FOB averaged $314/ton, down $6 from April, and Argentina Up River FOB averaged $318/ton, down $10. soybean oil prices rebounded as Argentina and Brazil average prices rose $6 and $8, respectively, to average $595/ton, while the United States average remained unchanged from April at $615/ton. Palm oil demand continued to decline as Malaysia and Indonesia reached its lowest price levels since October 2019. After mid-May, Malaysia and Indonesia palm oil prices rallied as global demand improved and economies began rebounding with a loosening of COVID-19 restrictions.
6 Malaysia palm oil averaged $529/ton, down $32 from April and Indonesia averaged $520, down $39. PROJECTION FOR 2020/21 Global 2020/21 oilseed production is forecast at 606 million tons, largely unchanged from May. Oilseed trade volumes are mostly unchanged. Global ending stocks are down slightly on higher consumption. Protein meal and oil production are up slightly on higher projected crush, primarily soybeans. PROJECTION FOR 2019/20 Global oilseed production is unchanged at 575 million tons. Oilseed trade volume is 2 million tons higher at 179 million tons exported, mostly on larger soybean trade. Crush is nearly 1 million tons higher at 498 million tons. Ending stocks are steady at 115 million tons.
7 Protein meal production is pegged at 339 million tons, up marginally on larger crush volume. Meal consumption is projected higher at 337 million tons on increased demand and greater production. Oil production, trade, and consumption are up fractionally. The projected season-average farm price for soybeans is unchanged at $ per bushel. Foreign Agricultural Service/USDA 2 June 2020 Global Market Analysis 290310330350370390US$/tonSOYBEAN EXPORT PRICESA rgentina (Up River)Brazil (Paranagua) (Gulf)280300320340360380400US$/tonSOYBEA N MEAL EXPORT PRICESA rgentina (Up River)Brazil 48% (Paranagua)US 48% (Gulf)420460500540580620660700740780820U S$/tonSOYBEAN AND PALM OIL EXPORT PRICESA rgentina (Up River) Soy OilBrazil (Paranagua) Soy OilUSA (Gulf)
8 Soy OilIndonesia Palm OilMalaysia Palm OilForeign Agricultural Service/USDA 3 June 2020 Global Market Analysis EXPORT SALES As of the week ending June 4, 2020, soybean accumulated exports (shipments) to China totaled million tons and million to the rest of the World . Outstanding sales have improved on recent sales to China but remain below 17/18 and 18/19 levels at million tons to China and million to the rest of the World . soybean export commitments (outstanding sales plus accumulated exports) to China are slightly higher than last year at million tons but remain below historical levels on slow exports.
9 Brazil exports to China remain high on a weak real and a record Brazilian soybean crop. Total commitments to the World lag behind last year, totaling million tons as export commitments to markets outside China remain below 18/19 levels. Foreign Agricultural Service/USDA 4 June 2020 Global Market Analysis2020/21 OUTLOOK CHANGES Note: All figures are in thousand metric tons. Country Commodity Attribute Previous Current Change Reason Canada Oil, Rapeseed Exports 3,330 3,430 100 Strong global demand and larger supplies Sudan Oilseed, Peanut Exports 60 160 100 Reflecting 19/20 forecast change 2019/20 OUTLOOK CHANGES Note: All figures are in thousand metric tons.
10 Country Commodity Attribute Previous Current Change Reason Argentina Meal, soybean Exports 29,000 28,000 -1,000 Slower exports with reduced crush volume Oilseed, soybean Imports 3,800 3,600 -200 Slower trade pace Oilseed, soybean Exports 8,000 9,000 1,000 Strong export volume forecast to China Oil, soybean Exports 5,500 5,350 -150 Reduced trade pace for remaining months China Meal, Sunflowerseed Imports 1,325 1,425 100 Strong imports from Ukraine Oilseed, soybean Imports 92,000 94,000 2,000 Greater supplies from Brazil and Argentina Oilseed, Peanut Imports 850 1,000 150 Strong pace of trade Sudan Oilseed, Peanut Exports 60 210 150 Strong exports to China European Union Oilseed, Sunflowerseed Imports 690 850 160 Record imports from Russia Ukraine Oilseed, soybean Exports 2,400 2,650 250 Strong pace of trade Brazil Meal, soybean Exports 16,300 16,800 500 Pace of trade Oilseed, soybean Imports 150 250 100 Larger imports from Paraguay Oilseed, soybean Exports 84,000 85,000 1000 Record monthly export volumes Turkey Oil, Sunflowerseed Exports 375 475 100 Record March and April trade United States Oilseed, Soybeans Exports 45,586 44.