Transcription of United States Department of Agriculture Sugar: World ...
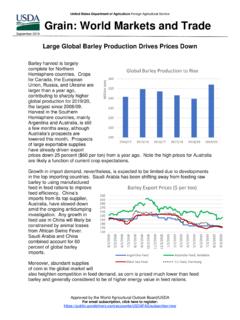
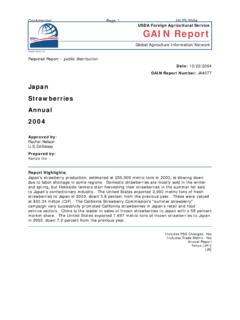
1 United States Department of Agriculture Foreign Sugar: World Markets and Trade Agricultural Service May 2019. Global Sugar Production Up Slightly in 2019/20: Gains in Brazil and European Union Offset Declines in India 200. 180. 160. 140. 120. Other 100. EU. 80 India Brazil 60. 40. 20. 0. Global production for Marketing Year (MY) 2019/20 is forecast up 2 million tons to 181 million (raw value) as higher production in Brazil and the EU more than offset an 8-percent decline in India. Consumption (up for over 25 consecutive years) is expected to rise due to growth in markets such as Egypt, India, Indonesia, and Pakistan. With high demand, exports are forecast up and global stocks are forecast 8 percent lower on reductions in India, China, Pakistan, and Thailand. To receive the circular via email, register at _____. Approved by the World Agricultural Outlook Board - USDA. Page 2. 2019/20 Sugar Overview production is forecast up 2 percent to million tons due to expected reduced early-season harvested area that pushes a large proportion of crop-year production into the 2019/20 marketing year.
2 Imports are 13 percent higher at million tons based on projected quota programs and the calculation of Needs as defined in the amended Suspension Agreement. Record consumption is forecast up slightly on population growth while stocks are down 1 percent. Brazil's production is forecast to rebound million tons to million as dry weather in December and January was offset by steady rainfall in February and March and improved the sugarcane harvest. Approximately 38 percent of the sugarcane crop is expected to be processed for sugar versus 62 percent for ethanol, a modest recovery for sugar from the record low levels in the previous crop. Consumption, exports, and stocks are all up with the higher production. India's production is expected to decline percent to million tons due to lower area and yields. Consumption is forecast at a record due to a growing economy. Exports are forecast at million tons with total exports expected to include million tons of sugar re-exported under the Advance Authorization scheme and the remaining million as commercial sales.
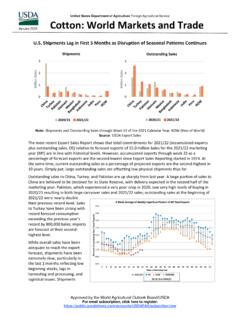
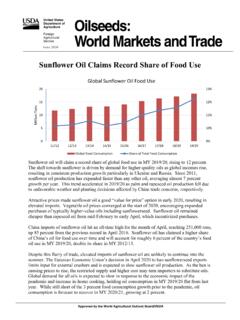
3 Stocks are down 4 percent but are more than double minimum stock requirements of around 3. month's consumption. Production in the European Union is forecast million tons higher to million on a return to average yields compared with last year's drought-hampered crop. Consumption is projected to be slightly lower as EU domestic sugar consumption has been stagnating for the last few years. Consumer preference for lower sugar-containing diets has encouraged food processors to reformulate products. With higher supplies, exports are projected to be up 20 percent to million tons while stocks grow slightly. Imports are forecast unchanged at million tons. China's production is forecast to China's Consumption Exceeds grow for the fourth straight year, up 100,000 tons to million, Production as Stocks Decline 18. primarily due to expanded Production Stocks Consumption 16. sugarbeet area in Inner Mongolia. 14. Million Metric Tons, Raw Value Although consumption is flat, it is 12.
4 Estimated that consumption of 10. starch-based sweeteners have displaced 3-4 million tons of sugar 8. in recent years. Imports are 6. unchanged, and stocks are 4. expected to fall for a fifth 2. consecutive year because of the 0. gap between domestic consumption and production. Mexico's production is forecast down 2 percent to million tons, reflecting a return to yields and recovery rates in line with normal weather conditions. Consumption is projected up slightly based on sweetener consumption per-capita being at the same level as in MY 2018/19. Exports, Foreign Agricultural Service/USDA 2 May 2019. Office of Global Analysis Page 3. forecast 29 percent lower, are projected at the expected level of Needs, as defined in the amended Suspension Agreement, plus exports to other markets. Stocks are unchanged. Pakistan's production is forecast down 300,000 tons to million as delays in sugarcane payments and reduced expectations surrounding support prices are prompting some farmers to switch to other crops such as cotton.
5 Consumption is slightly higher than last year's estimate, and exports are forecast down sharply to 500,000 tons. Stocks are expected to decrease to a 7-year low mainly due to decreased production. Thailand's production is forecast 290,000 tons lower to million on slightly lower area. Consumption is up slightly due to demand for direct sugar consumption and food-processing which is expected to more than offset the reduced sugar demand from non-alcoholic beverages (due to the excise tax on certain sugar-containing beverages that was implemented in 2017 and is set to increase in 2019). With high supplies, exports are forecast at a record million tons, also lowering stocks. Australia's production is forecast unchanged at million tons with anticipated stable area, although Australia's sugar industry has lately been vulnerable to severe weather events such as cyclones, drought, and flooding. For example, in February 2019, an intense monsoon resulted in heavy rainfall and flooding across north Queensland, with approximately 2 years of rain falling in 2 weeks.
6 Although the monsoon adversely affected some coastal sugarcane farms, the overall impact on the industry is not expected to be significant. Consumption and exports are unchanged at and million tons, respectively. China, Indonesia, Japan, Korea, Malaysia, Taiwan, the United States , and New Zealand are Australia's major export markets. Guatemala's production is forecast up 2 percent to a record million tons on favorable weather and a new local variety anticipated to bring higher yields. Consumption, exports, and stocks are all expected to be up with the increase in production. Selected MY 2018/19 Revisions from November 2018 Forecast: - Global production is down million tons to million. o India is cut million tons to million on lower yields. o EU is down million tons to million as drought took a toll on sugarbeet production. o Brazil is lowered million tons to million with more cane utilized for ethanol production versus sugar.
7 O Mexico is raised 186,000 tons because of good sugarcane yields. - Global imports are little changed overall at million tons. o India is boosted from zero to million tons due to a Duty-Free Import Authorization scheme and higher imports from Brazil. o United Arab Emirates is down 450,000 tons to million on lower imports from Brazil. o Japan is down 200,000 tons to million on lower imports from Australia. Foreign Agricultural Service/USDA 3 May 2019. Office of Global Analysis Page 4. - Global exports are down million tons to million. o EU is lowered million tons to million in line with reduced production. o India is down 600,000 tons to million. o Mexico is up nearly million tons to million due to higher shipments to markets outside the United States . - Global ending stocks are lowered million tons to million. o Brazil is down million tons to 220,000 due to lower production. o Pakistan is lowered 785,000 tons to million on less production.
8 O Indonesia is raised 700,000 tons to million on higher imports from Thailand and Australia. For further information, please contact Reed Blauer at (202) 720-0898 or The Sugar: World Markets and Trade circular is based on reports from FAS Overseas Posts since March 2019 and on available secondary information. The individual country reports can be obtained on FAS Online at: Future Releases and Contact Information Please visit to view archived and future releases. The next release of this circular is scheduled for November 2019. To receive the circular via email, go to: PSD Online The entire USDA PSD database is available online at: Additional Resources Please refer to the USDA-FAS Sugar website at: for additional data and analysis. Situation and outlook information on sugar and sweeteners can be obtained from the USDA-Economic Research Service at: Sugar Marketing Years - Countries are on a May-April Marketing Year with exceptions noted below.
9 April-March Brazil July-June Australia October-September Barbados, Belarus, Belize, Bolivia, China, Colombia, Costa Rica, Cuba, Dominican Republic, Egypt, El Salvador, European Union, Guatemala, Guyana, Honduras, India, Iran, Mexico, Morocco, Nicaragua, Pakistan, Panama, Russia, Serbia, Sudan, Turkey, Ukraine, United States , Venezuela, and Vietnam December-November Philippines and Thailand Foreign Agricultural Service/USDA 4 May 2019. Office of Global Analysis World Centrifugal Sugar: Production and Consumption 1,000 Metric Tons, Raw Value May 2014/15 2015/16 2016/17 2017/18 2018/19 2019/20. Production none Brazil 35,950 34,650 39,150 38,870 29,500 32,000. India 30,460 27,385 22,200 34,309 33,070 30,305. European Union 18,449 14,283 18,314 20,823 18,175 19,425. Thailand 10,793 9,743 10,033 14,710 14,190 13,900. China 11,000 9,050 9,300 10,300 10,600 10,700. United States 7,853 8,155 8,137 8,430 8,116 8,269. Mexico 6,344 6,484 6,314 6,371 6,572 6,466.
10 Russia 4,350 5,200 6,200 6,560 5,920 6,200. Pakistan 5,164 5,265 6,825 7,225 5,540 5,240. Australia 4,700 4,900 5,100 4,800 4,900 4,900. Guatemala 2,975 2,823 2,719 2,865 3,049 3,110. Turkey 2,055 2,000 2,500 2,500 2,700 2,750. Egypt 2,067 2,125 2,270 2,320 2,405 2,740. Colombia 2,350 2,250 2,300 2,500 2,400 2,400. South Africa 2,192 1,684 1,607 2,064 2,257 2,329. Philippines 2,150 2,135 2,500 2,200 2,100 2,200. Indonesia 2,100 2,025 2,050 2,100 2,200 2,100. Iran 1,450 1,640 1,770 2,150 2,000 2,100. Cuba 1,850 1,625 1,800 1,100 1,600 1,750. Argentina 2,150 2,060 2,050 1,870 1,665 1,680. Ukraine 1,728 1,638 2,156 2,180 1,848 1,646. Peru 1,480 1,206 1,238 1,080 1,255 1,400. Vietnam 1,510 1,330 1,520 1,540 1,300 1,400. Japan 795 850 720 840 780 800. Eswatini 687 695 587 650 730 800. Other 14,980 13,667 14,670 14,139 14,054 14,124. Total 177,582 164,868 174,030 194,496 178,926 180,734. Human Dom. Consumption none India 26,500 26,800 25,500 26,500 27,500 28,500.