Transcription of United States Firefighter Injuries in 2020 - NFPA
1 Copyright 2021 National fire Protection Association ( nfpa ) United States Firefighter Injuries in 2020 Richard Campbell and Ben EvartsDecember 2021 nfpa Research pg. 1 Key Findings An estimated 64,875 Firefighter Injuries occurred while on duty in 2020, an increase of seven percent from the 2019 injury total. In addition to Injuries , there were 20,900 documented exposures of firefighters to infectious diseases and 17,050 exposures to hazardous conditions. firefighters were more likely to be injured at fireground operations than at other types of duties.
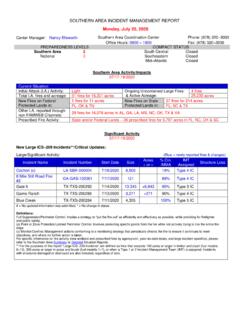
2 In 2020, 22,450 of all the reported Firefighter Injuries occurred at the fireground (35 percent). The leading cause of fireground Injuries was overexertion or strain (31 percent). Strains, sprains, or muscular pain Injuries accounted for approximately two out of five Injuries on the fireground (40 percent). Other major fireground Injuries included wounds, cuts, bleeding, or bruising (13 percent); smoke or gas inhalation (10 percent); and thermal stress (frostbite or heat exhaustion) (8 percent). Non-fireground Injuries included 4,975 Injuries while responding to or returning from an incident ; 7,550 Injuries incurred during training activities; 13,650 Injuries at non- fire emergency incidents; and 16,250 Injuries during other on-duty activities.
3 Strains, sprains, and muscular pain accounted for 49 percent of all the non-fireground Injuries . Background and Objectives firefighters work in varied and complex environments that expose them to a number of potential hazards. Each year, nfpa gathers information about Firefighter deaths and Injuries to provide national statistics on their frequency, extent, and characteristics. Earlier this year, nfpa reported that there were 140 on-duty Firefighter fatalities in 2020. A better understanding of how firefighters become injured or ill on the job can help inform intervention efforts to ensure Firefighter safety and health.
4 This report examines Firefighter Injuries in the United States in 2020. The results are based on data collected by the nfpa fire experience survey. This year's report includes among its results: An estimate of the total number of Firefighter Injuries in 2020 Estimates of the number of Injuries by type of duty An estimate of the number of exposures to infectious diseases Trends in Firefighter Injuries and rates Fireground Injuries by cause fire department vehicle accidents and the resulting Firefighter Injuries nfpa Research pg.
5 2 US Firefighter Injuries in 2020 Based on data reported by fire departments responding to the 2020 nfpa national fire experience survey, we estimate that 64,875 Firefighter Injuries occurred in the line of duty in 2020. While this represents a seven percent increase over the 2019 total, this is nevertheless the sixth-lowest number of Injuries since 1981 (See Figure 1). Over the past 20 years, the number of reported Firefighter Injuries has been much lower than prior years due in part to a redefinition of Injuries that places exposures to hazardous conditions and infectious diseases in their own categories, some of which may have previously been included in injury totals.
6 Figure 1. Total Firefighter Injuries by Year: 1981 2020 nfpa estimates that there were 20,900 exposures to infectious diseases such as hepatitis, meningitis, HIV, and COVID-19 in 2020, more than two and a half times the 7,675 exposures in 2019. This increase was almost certainly due to the COVID-19 pandemic that swept through the country in 2020. We also estimate there were 17,050 exposures to hazardous conditions such as asbestos, radioactive materials, chemicals, and fumes last year. Injuries by Type of Duty As in past reports, the types of duties being performed at the time of injury are divided into five categories: responding to or returning from an incident (includes fire and non- fire emergencies); at a non- fire emergency (includes rescue calls, hazardous calls, and natural disaster calls); during training; during other on-duty activities ( , inspection or maintenance duties); and at the fireground (includes structure fires, vehicle fires, brush fires, etc.)
7 Estimates of Firefighter Injuries by type of duty are displayed in Figure 2. Figure 2. Firefighter Injuries by Type of Duty: 2020 The fireground was the location with the largest share of Firefighter Injuries in 2020, accounting for 22,450 Injuries (35 percent of the injury total), a six percent decrease in fireground Injuries over the total in 2019 (see Table 1 at end of report). In addition, the rate of fireground Injuries per 1,000 fires in 2020 represented the lowest rate in 38 years (Table 1). 103,34064,875020,00040,00060,00080,00010 0,000120,0001981198519901995200020052010 201520204,97522,45013,6507,55016,25005,0 0010,00015,00020,00025,000 Responding toor Returningfrom IncidentsAt FireGroundAt Non-FireEmergenciesTrainingOther On-Duty Activities nfpa Research pg.
8 3 Figure 3. Fireground Injuries by Year: 1981 2020 The number of Injuries at non- fire emergencies increased by 42 percent between 1981 and 2020, from 9,600 to 13,650 (Figure 4). However, the injury rate per 1,000 non- fire emergencies declined during that same period (from to percent), largely because the number of non- fire emergencies increased at a higher rate than the number of Injuries at non- fire responses. In general, the total number of Injuries at non- fire emergencies has shown substantial fluctuation, as shown in Figure 4.
9 Figure 4. Injuries at Non- fire Emergencies: 1981 2020 Another 7,550 Firefighter Injuries occurred during training activities, while 16,250 Injuries occurred during other on-duty activities. In addition, 4,975 Firefighter Injuries occurred while responding to or returning from an incident in 2020. Nature and Causes of Fireground Injuries As the major location of Firefighter Injuries , Injuries on the fireground are a particular concern. The major types of Injuries that occurred during fireground operations were strains, sprains, or muscular pain, which accounted for 40 percent of the Injuries ; wounds, cuts, bleeding, and bruising, which accounted for 13 percent; smoke or gas inhalation, which accounted for 10 percent; and thermal stress (frostbite or heat exhaustion), which accounted for 8 percent.
10 See Figure 5. Figure 5. Fireground Injuries by Nature of Injury: 2020 67,50022,450010,00020,00030,00040,00050, 00060,00070,00080,0001981198519901995200 020052010201520209,38513,6505,0007,0009, 00011,00013,00015,00017,00019,0001981198 5199019952000200520102015202016%2%2%3%5% 8%10%13%40%0%10%20%30%40%50%OtherBurns and smoke inhalationDislocation, fractureOther respiratory distressBurns, fire or chemicalThermal stressSmoke or gas inhalationWound, cut, bleeding, bruisingStrain, sprain, muscular pain nfpa Research pg.