Transcription of United States Small Business Economic Profile
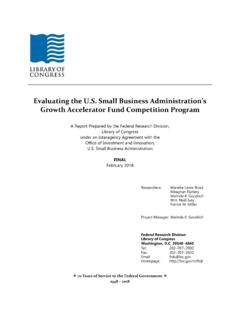
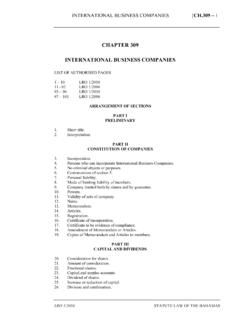
1 United States Small Business Profile , 20161 SBA Office of AdvocacyUNITED millionSmall millionSmall Business US US millionnet new in US exporters3 OVERALLUS ECONOMY Multiple Economic indicators, including real gross domestic product (GDP), consistently signaled a strengthening USeconomy in 2015. In the third quarter of 2015, the United States grew at an annual rate By comparison, theUnited States s 2014 growth up from the 2013 level (Source:BEA) The employment situation in the United States improved. At the close of 2015, unemployment , down the close of 2014. (Source:CPS)EMPLOYMENT US Small businesses millionpeople, the private workforce, in 2013. (Source:SUSB) Firms with fewer than 100 employees have the largest shareof Small Business employment. See Figure 1 for further de-tails on firms with employees. (Source:SUSB) Private-sector employment 2015. Thiswas below the previous year s increase (Source:CES) The number of proprietors increased in 2014 to the previous year.
2 (Source:BEA) Small businesses millionnet jobs in the seven BDS size-classes, firms employing 250to 499 employees experienced the largest gains, adding257,245net jobs. The smallest gains were in firms employ-ing 5 to 9 employees which added84,020net jobs. (Source:BDS)Figure 1: US Employment by Firm Employees20-99 Employees100-499 Employees>500 Employees2013025 M50 M75 M100 M125 M20002010[The Small Business Profiles are produced by the US Small Business Administration s Office of Advocacy. Each report incorporates the most up-to-date government data to present a unique snapshot of Small businesses are defined as firms employing fewer than 500employees. Hyperlinks to data sources and report generation information are provided in Table ,3 Net Small Business jobs change and exporter share are based on newly released 2013 BDS and 2012 ITA statistic tracks changes between 2007 and 2012 based on the Survey of Business Owners (SBO) 2015 States Small Business Profile , 20162 SBA Office of AdvocacyINCOME ANDFINANCE The number of banks reported in the Call Reports between June 2014 and June 2015 declined.]
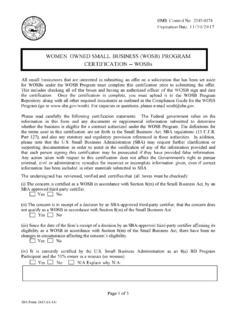
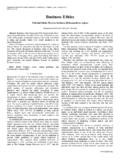
3 (Source:FDIC) In 2014, millionloans under $100,000 (and valued at $ billion) were issued by US lending institutions reportingunder the Community Reinvestment Act. (Source:FFIEC) The median income4for individuals who were self-employed at their own incorporated businesses was $49,204in individuals self-employed at their own unincorporated firms, this figure was $22,209. (Source:ACS)[4 Median income represents earnings from all sources. Unincorporated self-employment income includes unpaid family workers, a very smallpercent of the unincorporated 2: US Changes in Business Ownershipby Demographic GroupAfrican 3: US Self-Employment withinDemographic Figure 2 displays the change in overall firm ownership for each demographic group from 2007 to 2012 based on theSurvey of Business Owners (SBO) for the United States , released in December 2015. Figure 3 displays the percent of each demographic group identified as self-employed according to the 2014 AmericanCommunity Survey (ACS) 5-year In the second quarter of 2014,220,000establishmentsstarted up5in the United States and205, generated805,000new jobs while exits caused717,000job losses.]
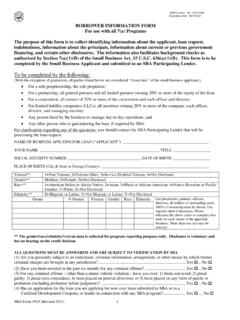
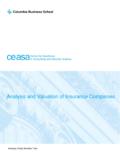
4 (Source:BDM) Figure 4 displays startup and exit rates from 2005 to series is smoothed across multiple quarters to high-light long-run trends. (Source:BDM)[5 STARTUPSare counted when Business establishments hire at leastone employee for the first time. The BLS terms thesebirths, as distinctfrom the BLSopeningscategory which includes seasonal when establishments go from having at least one em-ployee to having none, and then remain closed for at least a year. TheBLS terms these eventsdeaths, as distinct from theclosingscategorywhich includes seasonal 4: US Private Startup and Exit ratestartup rateUnited States Small Business Profile , 20163 SBA Office of AdvocacyINTERNATIONALTRADE A total of304,223companies exported goods from the United States in 2013. Among these,297,343, , weresmall firms; they the United States s total known export value. (Source:ITA)SMALLBUSINESSES BYINDUSTRYT able 1: US Small Firms by Industry, 2013(sorted by Small employer firms)Industry1 499 Employees1 19 EmployeesNonemployerFirmsTotal SmallFirmsProfessional, Scientific, and Technical Services778,090731,3413,235,9064,013,996 Other Services (except Public Administration)]
5 670,468626,8503,583,7424,254,210 Retail Trade649,764595,2801,906,5972,556,361 Construction645,479598,0392,368,4423,013 ,921 Health Care and Social Assistance642,586561,7061,959,7232,602,3 09 Accommodation and Food Services502,076397,330346,280848,356 Administrative, Support, and Waste Management325,474289,7992,032,5162,357,9 90 Wholesale Trade309,568267,370406,469716,037 Real Estate and Rental and Leasing275,298262,8502,448,2822,723,580 Manufacturing248,155188,964343,025591,18 0 Finance and Insurance233,184216,130706,394939,578 Transportation and Warehousing167,496149,2621,102,2551,269, 751 Arts, Entertainment, and Recreation116,159100,8671,256,6941,372,8 53 Educational Services85,15167,144616,952702,103 Information70,79261,051326,526397,318 Mining, Quarrying, and Oil and Gas Extraction21,59418,222106,610128,204 Agriculture, Forestry, Fishing and Hunting21,32319,997239,863261,186 Utilities5,7154,51119,34425,059 Total5,768,3725,156,71323,005,62028,773, 992[Totals for Tables 1 and 2 differ from SUSB s nationwide tallies due to firms with establishments in more than one industry and the omission ofindustry classifications not reported by NES.]
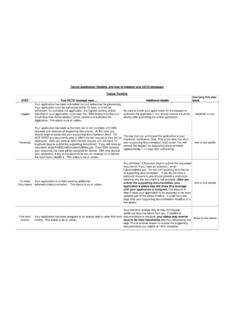
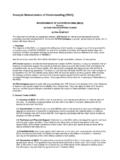
6 (Source: NES and SUSB)s Indicates samples deemed too Small to represent the population according to States Small Business Profile , 20164 SBA Office of AdvocacySMALLBUSINESSEMPLOYMENT BYINDUSTRYT able 2: US Employment by Industry and Firm Size, 2013(sorted by Small firm employment)IndustrySmall BusinessEmploymentTotal PrivateEmploymentSmall BusinessEmployment ShareHealth Care and Social Assistance8,515,10618,598, and Food Services7,454,78812,395, Trade5,370,41915,023, ,059,75911,276, , Scientific, and Technical Services4,869,2778,275, Services (except Public Administration)4,536,3405,282, ,526,3895,470, , Support, and Waste Management3,523,80210,185, Trade3,463,6225,908, and Insurance1,918,1226,063, and Warehousing1,585,5394,287, Services1,532,2143,513, Estate and Rental and Leasing1,361,3521,972, , Entertainment, and Recreation1,315,7212,112, ,0653,266, , Quarrying, and Oil and Gas Extraction288,789732, , Forestry, Fishing and Hunting132,812154, ,352638, ,435,468115,156, 5: US County-Level Job Changes, 2015(CEW)Job Change 65% to 0%0% to to to 420%Table 3.
7 Abbreviations and ResourcesACSA merican Community Survey, US Census BureauBEAB ureau of Economic AnalysisBDMB usiness Employment Dynamics, BLSBDSB usiness Dynamics Statistics, US Census BureauBLSB ureau of Labor Statistics, US Department of LaborCESC urrent Employment Statistics, BLSCEWC ensus of Employment and Wages, BLSCPSC urrent Population Survey, BLSFDICF ederal Deposit Insurance CorporationFFIECF ederal Financial Institutions Examination CouncilITAI nternational Trade AdministrationNESN onemployer Statistics, US Census BureauSBOS urvey of Business Owners, US Census BureauSUSBS tatistics of US Businesses, US Census BureauAll profiles, source data, methodology notes, and county-levelemployment statistics are available