Transcription of Updated Death and Injury Rates of U.S. Military Personnel ...
1 Working Paper Series Congressional Budget Office Washington, DC Updated Death and Injury Rates of Military Personnel During the Conflicts in Iraq and Afghanistan Matthew S. Goldberg December 2014 Working Paper 2014-08 To enhance the transparency of the work of the Congressional Budget Office (CBO) and to encourage external review of that work, CBO s working paper series includes papers that provide technical descriptions of official CBO analyses as well as papers that represent independent research by CBO analysts. Papers in this series are available at This paper has not been subject to CBO s regular review and editing process. The views expressed here should not be interpreted as CBO s. The author thanks Elizabeth Bass, Heidi Golding, Jeffrey Kling, Jared Maeda, and David Mosher for comments and suggestions, and Jeanine Rees for editorial assistance. Abstract In Operation Iraqi Freedom, which ended on August 31, 2010 , some 3,482 hostile deaths occurred among Military Personnel and 31,947 people were wounded in action (WIA).
2 More than 1,800 hostile deaths occurred during Operation Enduring Freedom (in Afghanistan and surrounding countries) through November 2014; about 20,000 more people were wounded in action. In the Iraq conflict, a larger proportion of wounded Personnel survived their wounds than was the case during the Vietnam War, but the increased survival Rates are not as high as some studies have asserted. Prior to the surge in troop levels that began in early 2007, the survival rate was percent in Iraq compared with percent in Vietnam. Amputation Rates are difficult to measure consistently, but I estimate that percent of all WIA and percent of medically-evacuated WIA from the Iraq and Afghanistan theaters combined resulted in the major loss of a limb. An elevated non-hostile Death rate (including deaths from accidents, illnesses, or suicides) in Iraq before the surge resulted in about 220 more deaths during the first four years of that conflict (March 2003 March 2007) than would have been expected in peacetime among a population the size of the one that deployed to Iraq.
3 Relative to such a peacetime benchmark, I find essentially no additional non-hostile deaths in Iraq after March 2007. For the conflict in Afghanistan, I estimate about 200 additional non-hostile deaths relative to a comparable benchmark through December 2013. 1 Introduction Operation Enduring Freedom (OEF) began in Afghanistan in October 2001 as an immediate reaction to the terrorist attacks on the United States on September 11 of that year. More than 1,800 hostile deaths and about 20,000 wounded-in-action (WIA) incidents among Military Personnel in the Afghanistan theater had been recorded through November On May 27, 2014, President Barack Obama announced his plan to reduce the Military presence to 9,800 by the beginning of 2015, eventually tapering down to a smaller number for normal embassy presence and security assistance by the end of 2016. Operation Iraqi Freedom (OIF) began with the invasion of Iraq on March 19, 2003.
4 OIF officially closed on August 31, 2010 with a final tally of 3,482 hostile deaths and 31,947 Elements of the Military remained in Iraq to advise and assist Iraqi security forces as part of Operation New Dawn (OND), which itself officially closed on December 15, 2011, with the withdrawal of essentially all remaining Military Personnel . In an earlier paper, I examined the Death and Injury Rates in OIF through That paper compared the Rates before and during the surge in Iraq that took place between February 2007 and july 2008 ; it also compared the pre-surge Rates in Iraq to those that had prevailed during the course of the Vietnam War. Now that OIF is over and the conflict in Afghanistan is, apparently, nearly over, in this paper I look back over the conflicts in Iraq and Afghanistan (2003 2010 and 2001 2013, respectively), focusing on the periods of the troop surges in those theaters, and present final (or nearly final) statistics relating to hostile and non-hostile deaths, WIA incidents, and amputations.
5 DoD s Casualty Classification System The Department of Defense (DoD) defines a casualty as any soldier who is lost to his or her unit in the theater of operations for medical reasons. (Although members from all service branches have been killed or injured in Iraq and Afghanistan, I use the term soldiers to include not only Army Personnel but also sailors, airmen, and marines.) DoD classifies a casualty as hostile if it is the direct result of combat between forces and opposing forces, or if it occurs on the way to or from a combat mission; that definition excludes injuries or deaths caused by natural elements, self -inflicted wounds, or combat DoD further distinguishes three categories of hostile casualties, depending on whether and where the injured soldiers die: 1 Department of Defense: Defense Casualty Analysis System, Operation Enduring Freedom (OEF).
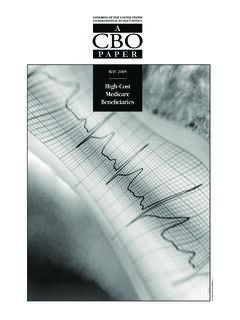
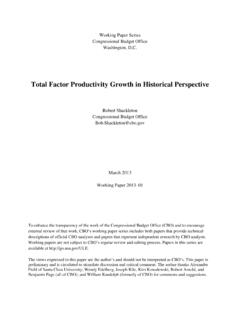
6 Available at ; accessed December 12, 2014. 2 Department of Defense: Defense Casualty Analysis System, Operation Iraqi Freedom (OIF). Available at ; accessed December 12, 2014. 3 Goldberg, MS: Death and Injury Rates of Military Personnel in Iraq. Mil Med 2010 ; 175(4): 220 6. 4 Department of Defense: DoD Dictionary of Military and Associated Terms, Joint Publication 1-02 (as amended through March 15, 2014). Available at ; accessed December 12, 2014. 2 Figure 1. Classification of Military Casualties, Injuries, and Disease Killed-in-action (KIA): those who die immediately on the battlefield; Died -of-wounds (DOW): those who survive Injury on the battlefield, but die after admission to a forward surgical station or a combat support hospital; and Wounded-in-action (WIA): those who survive their injuries beyond initial hospital KIA and DOW are often combined as hostile deaths, and I will do so henceforth.
7 DoD also reports non-hostile deaths, which it treats as an additional category of casualties (see Figure 1). Finally, although non-fatal incidents of disease and non-battle Injury (DNBI) are not considered casualties, DoD does tabulate the more serious incidents those that require evacuation from the combat theater. The Surges in Iraq and Afghanistan Timeline in Iraq The surge in the Iraq theater began in February 2007 and ended in july 2008 when President George W. Bush declared that all additional troops had returned to the The surge pushed the number of Army brigade combat teams (BCTs) up from 15 to 20, while also increasing the number of Marine Corps battalions. The precise number of troops associated with the surge has been difficult to determine, in part because the Bush Administration s announcements in 2007 did not appear to include the support troops that generally accompany combat brigades in theater.
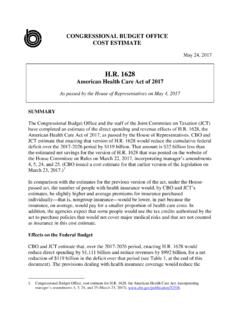
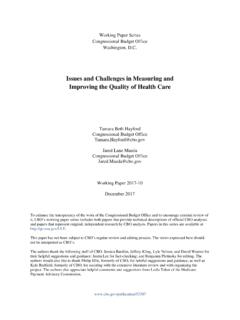
8 Even if there had been no surge, the number of troops is difficult to estimate because brigades and 5 Holcomb JB, Stansbury LG, Champion HR, Wade C, Bellamy RF: Understanding Combat Casualty Care Statistics. J Trauma 2006; 60(2): 397 401. 6 Bush GW: President George W. Bush s White House press conference, july 31, 2008 . Available at ; accessed December 12, 2014. 3 Figure 2. Troop Levels and Deaths During the War in Iraq, 2003 2010 Troop-Years of Exposure (x 100,000) Number of Deaths Note: A troop -year is the equivalent of a single soldier serving for a period of a year. their supporting units are rotated into and out of the theater on a seasonal basis. In my earlier paper I estimated the size of the surge in Iraq at 37,000 troops. I estimated the hostile Death (combining KIAs and DOWs) and WIA Rates in Iraq using the method developed by the demographers Preston and Buzzell to measure the denominator the number of troop-years of exposure (a troop-year is the equivalent of a single soldier serving in the wartime theater for a period of a year).
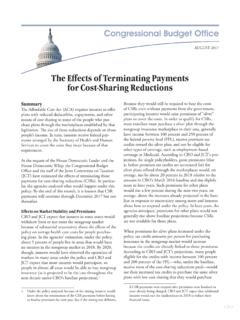
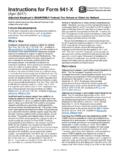
9 7 The hostile Death rate in Iraq increased during the early months of the surge: as shown in Figure 2, the cumulative number of hostile deaths climbed faster than cumulative Later in the surge, the number of hostile deaths leveled off and the rate declined to below the pre-surge level. A similar pattern was observed during the surge for the number of WIAs (see Figure 3). In all, I estimate million troop-years of exposure through the end of OIF in August 2010 , and 550,000 troop -years in OEF through December 2013. Those totals are broadly consistent with a RAND Corporation estimate of about million troop-years for the Army (the service branch that has provided the bulk of troops to the two conflicts) over the narrower timespan of September 2001 through December 7 Preston S, Buzzell E: Mortality of American troops in the Iraq war.
10 Popul Dev Rev 2007; 33(3): 555 66. 8 Department of Defense: Defense Manpower Data Center, Military Personnel Statistics. Available at ; accessed December 12, 2014. 9 Baiocchi D: Measuring Army Deployments to Iraq and Afghanistan. RAND Corporation, 2013. Available at ; accessed December 12, 2014. 4 Figure 3. Troop Levels and Soldiers Wounded in Action During the War in Iraq, 2003 2010 Troop-Years of Exposure (x 100,000) Number of Wounded Note: A troop -year is the equivalent of a single soldier serving for a period of a year. Timeline in Afghanistan The surge in Afghanistan, which I define the encompassing the 18-month period from January 2010 through June 2011, was more precipitous than the one in Iraq. About 35,000 troops were deployed to Afghanistan when President Obama took office in January 2009. That number had doubled to 70,000 by December 2009, at which time President Obama announced the surge during a speech at the United States Military Academy (West Point).