Transcription of Urban and Rural Victimization - NCJRS
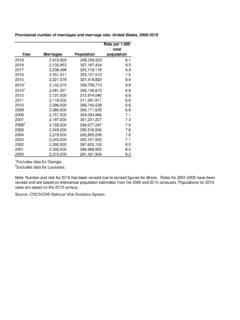
1 Urban and Rural VictimizationTrendsSince 1995, serious violent victimizations in Urban areas have decreased by approximately 72%. Other forms of Victimization , including simple assault, personal theft, and household burglary have declined by 74%, 84%, and 52%, respectively. In comparison, serious violent victimizations in suburban and Rural areas have decreased by 65% and 48%, while simple assaults have dropped 71% and 66%. On average, motor vehicle and household thefts have declined by about 75% and 62% across Urban , suburban, and Rural You Know?Motor vehicle theft occurs times more frequently in Urban areas than Rural rate of household burglary is greater in Rural areas compared to suburban areas but lower than the rate of household burglary in Urban National Crime Victims Rights Week Resource Guide: Crime and Victimization Fact SheetsWhile national-level crime statistics provide important information regarding overall crime trends, they cannot yet demonstrate differences in crime and Victimization at the sub-national level.
2 For instance, reporting local data through the FBI s Uniform Crime Reporting (UCR) Program is voluntary, making it difficult to isolate factors contributing to crime. The Bureau of Justice Statistics has recognized the need for sub-national Victimization data, and is working to estimate crime at the state and local levels. Currently, results from the UCR and the National Crime Victimization Survey (NCVS) indicate that cities with a larger population generally have higher crime rates than suburban or Rural cities. While dif-ferences in crime rates may be related to population size, they may also be caused by other local For example, Rural policing agencies may have organizational, resource-related, or technological differences compared to their Urban and suburban counterparts, resulting in underreported crime and For more about the UCR and NCVS, see the Crime and Victimization in the United States fact sheet in this 2014, victims from Urban areas accounted for: 55% of all rapes and sexual assaults, 50% of robberies, and 31% of aggravated assaults.
3 Victims from suburban areas accounted for 51% of all aggravated assaults. And victims from Rural areas accounted for: 10% of rapes and sexual assaults, 6% of robberies, and 18% of aggravated Victimization in Urban , Suburban, and Rural CommunitiesC rate per 1,000 households199519992003200720112005201330 0199720092001 UrbanSuburbanRuralTheft:UrbanSuburbanRur alHousehold Burglary:UrbanSuburbanRuralMotor Vehicle Theft:050100150200250300 Personal Victimization by Type of CommunityC rate per 1,000 people199519982001200720102004602013 UrbanSuburbanRuralSimple Assault:0 60 UrbanSuburbanRuralSerious Violent Victimization .
4 Victimization by Location of ResidenceCRape/Sexual assaultAggravated assaultRobbery60%55503135104365118 UrbanSuburbanRuralSOURCESA Mark T. Berg and Janet L. Lauritson, Telling a Similar Story Twice? NCVS/UCR Convergence in Serious Violent Crime rates in Rural , Suburban, and Urban Places (1973-2010), Journal of Quantitative Criminology (2015)B Ralph A. Weisheit, David Falcone, and Edward Wells, Rural Crime and Rural Policing, (National Institute of Justice, 1994), Bureau of Justice Statistics, National Crime Victimization Survey, Concate-nated File, 1995 - 2014, ( Department of Justice)D GLSEN, 2013 National School Climate Survey: The Experiences of LGBT Youth in Our Nation s Schools, (2014), of Urban areas experienced the highest rates of Victimization in 2014.
5 While rates of violent Victimization in Urban areas were similar for both men and women ( and per 1,000 individuals, respectively), the rate of violent Victimization in suburban areas was about 23% lower for women than for men. Similarly, in Rural areas the rate of Victimization among women was about 32% lower than among 2014, rates of Victimization for different age groups were similar across Urban , suburban, and Rural communities. Notably, youth ages 15 17 in Rural areas were victimized at a rate greater than youth of the same age in Urban areas, and 4x greater than youth in suburban 2013, 12% of LGBTQ students in Rural areas reported that they had been physically assaulted because of their sexual orientation about as many victims as in Urban or suburban areas.
6 Similarly, 8% of Rural students who identified as gender nonbinary reported being physically assaulted, compared to 6% of Urban and 5% of suburban 56% of victims of serious violent Victimization in 2014 reported their Victimization to the police. Among Urban and suburban locales, rape and sexual assault were the least reported form of violent Victimization , averaging about 30% each. Comparatively, 60% of rape and sexual assault victims in Rural communities said that they had reported their Victimization to the Data on Urban and Rural CrimeViolent Victimization by Locale and AgeC rate per 1,000 peopleMenWomenSerious Violent Victimization by Locale and SexC rate per 1.
7 000 peopleVictims Who Reported Victimization to PoliceC Sexual assaultAggravated assaultRobbery100%UrbanSuburbanRural3059 73296963605544 Simple assault384144100%UrbanSuburbanRural28243 2342080181935242412 1415 1725 3450+18 2021 2435 4950 6420231921181328382053221 LGBT Students Who Were Victims of Sexual AssaultDSexual orientationGender expressionUrbanRuralSuburban15%